 11
11peptides
spectra
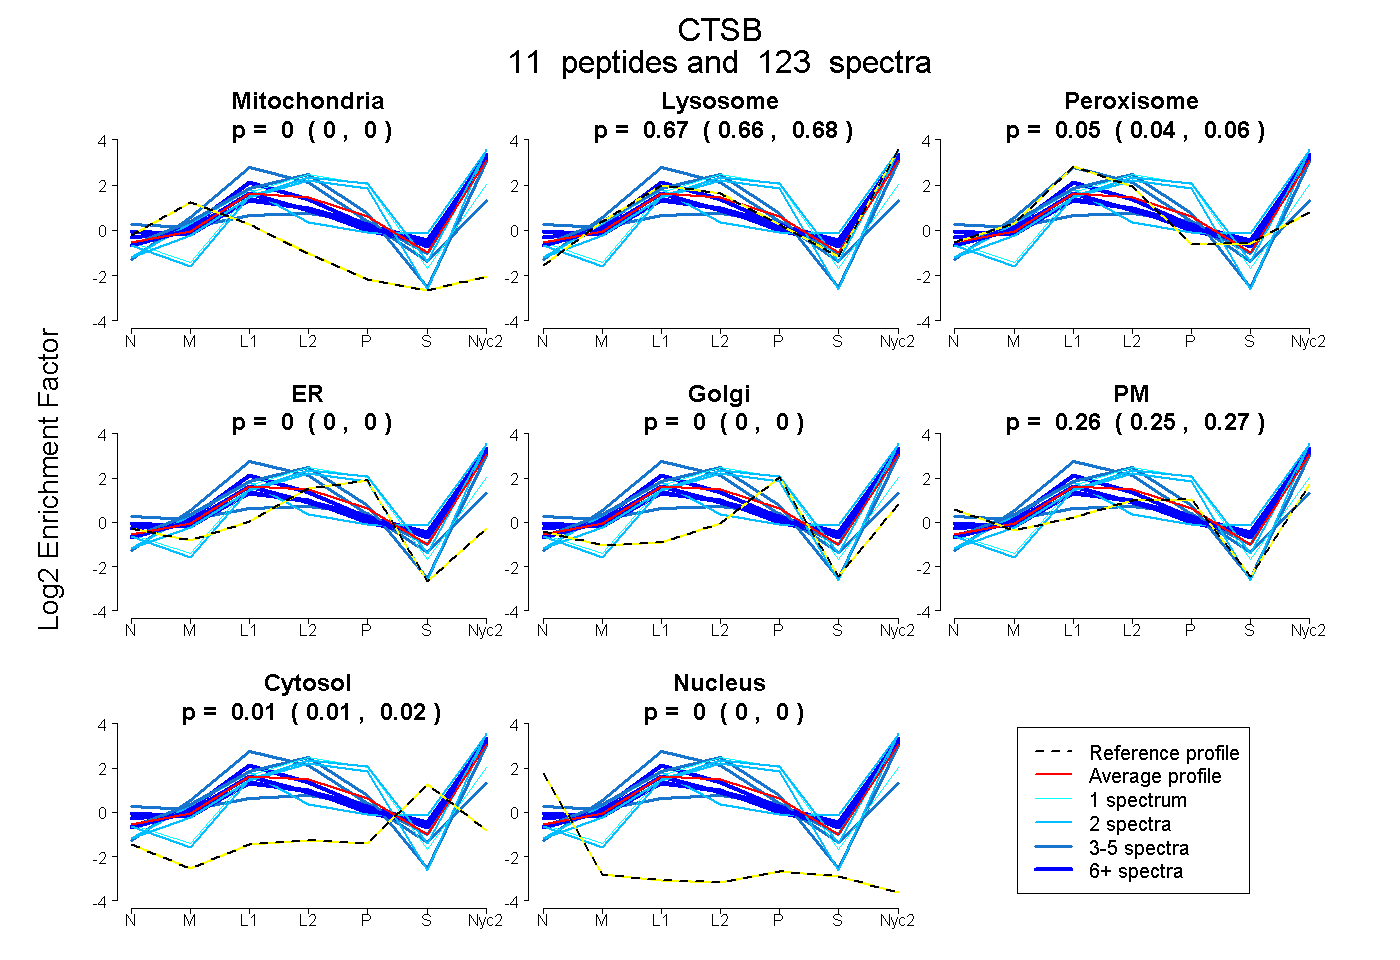
0.000 | 0.000
0.663 | 0.684
0.043 | 0.064
0.000 | 0.000
0.000 | 0.000
0.247 | 0.266
0.008 | 0.018
0.000 | 0.000
8peptides
spectra
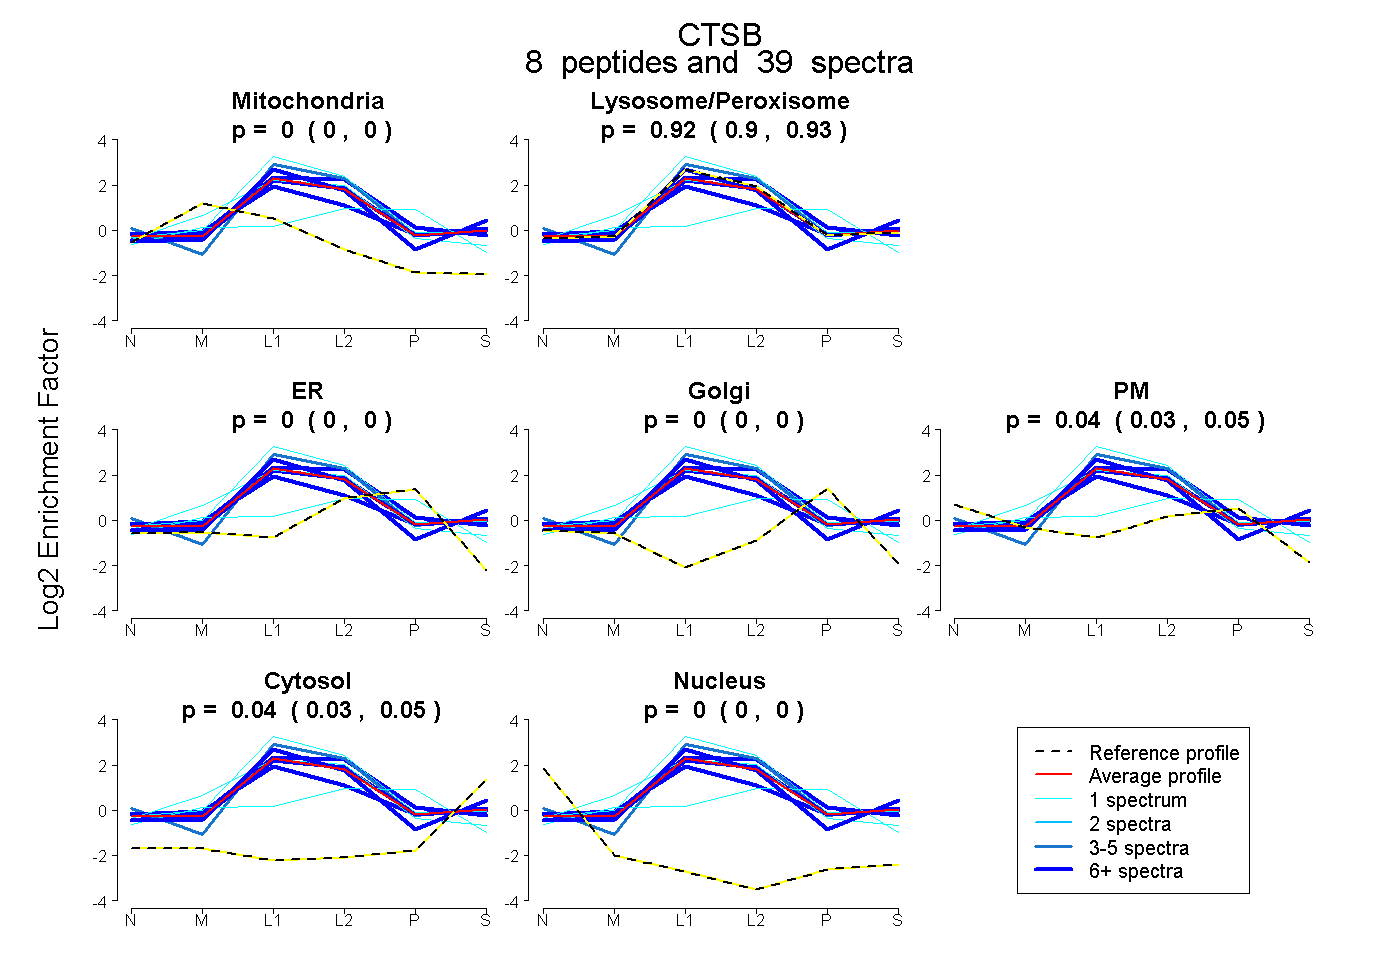
0.000 | 0.000
0.905 | 0.926
0.000 | 0.000
0.000 | 0.000
0.032 | 0.052
0.032 | 0.047
0.000 | 0.000
9peptides
spectra
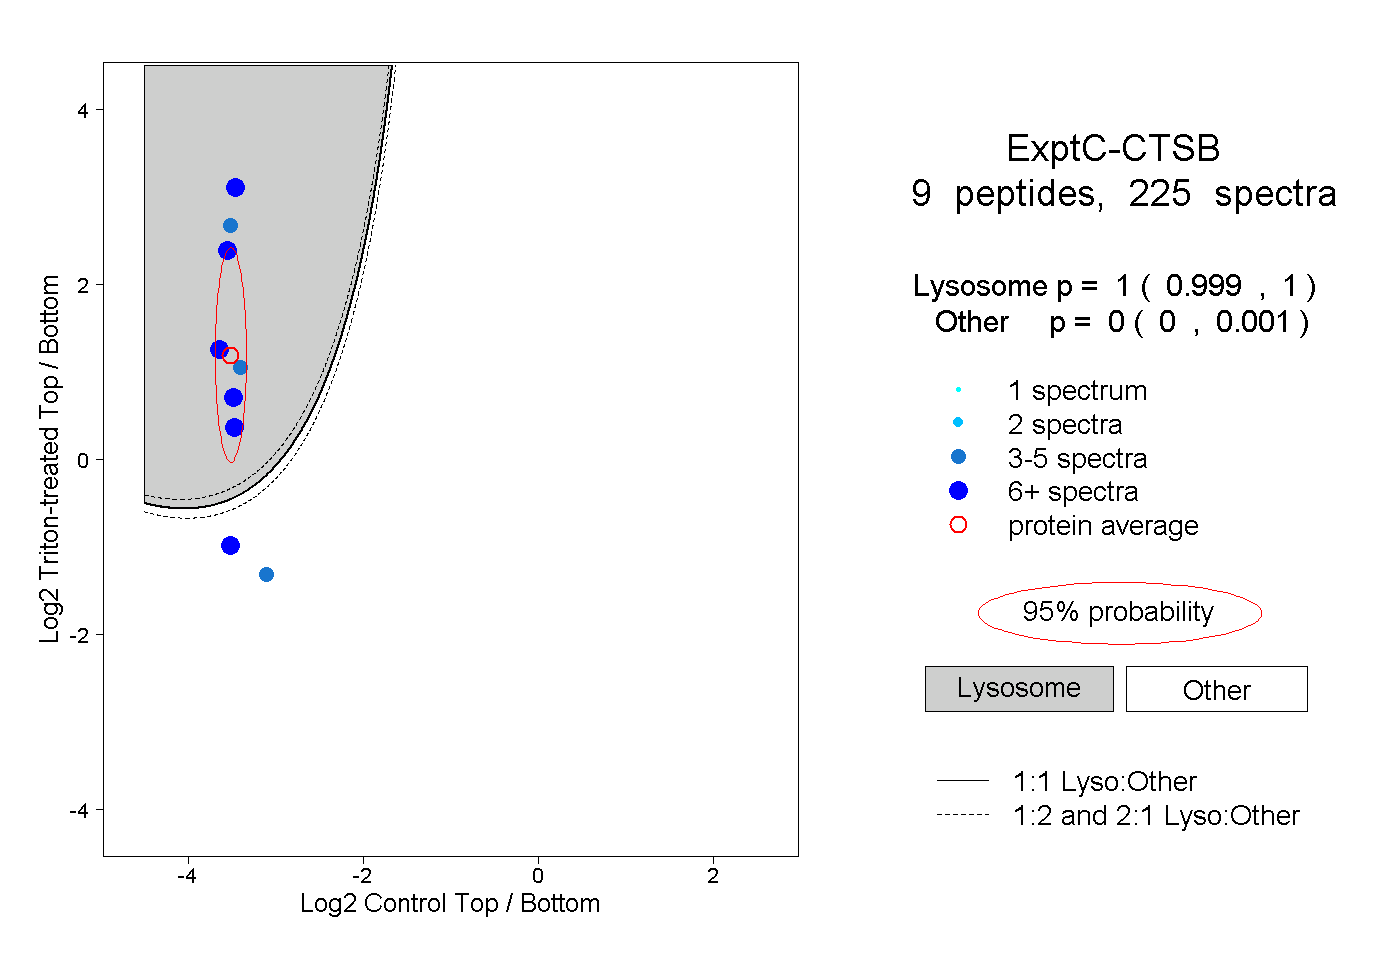
0.999 | 1.000
0.000 | 0.001
5peptides
spectra
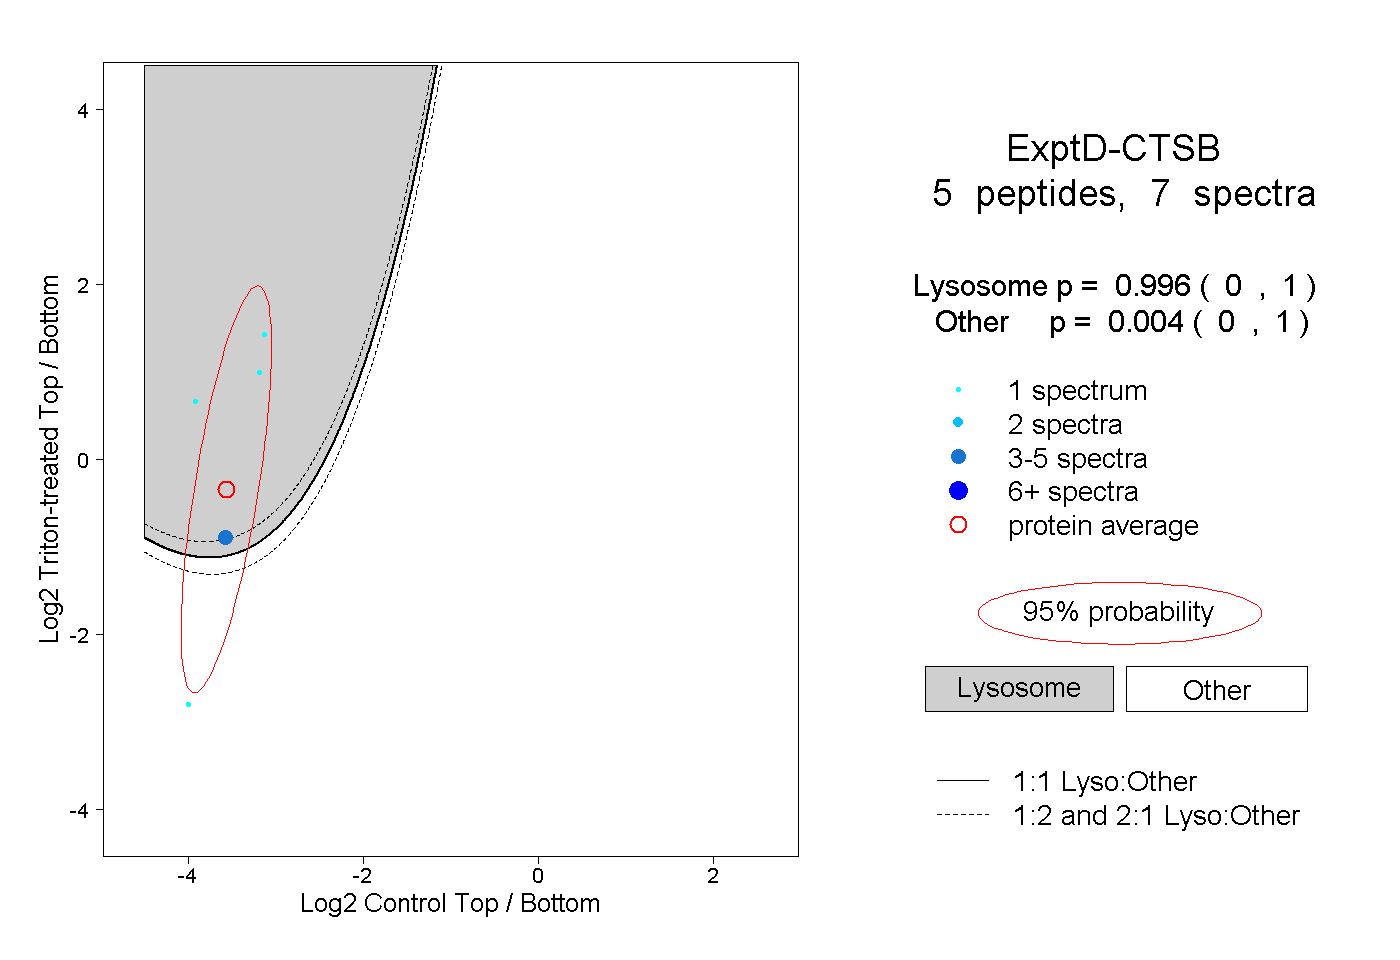
0.000 | 1.000
0.000 | 1.000