 11
11peptides
spectra
0.000 | 0.000
0.663 | 0.684
0.043 | 0.064
0.000 | 0.000
0.000 | 0.000
0.247 | 0.266
0.008 | 0.018
0.000 | 0.000
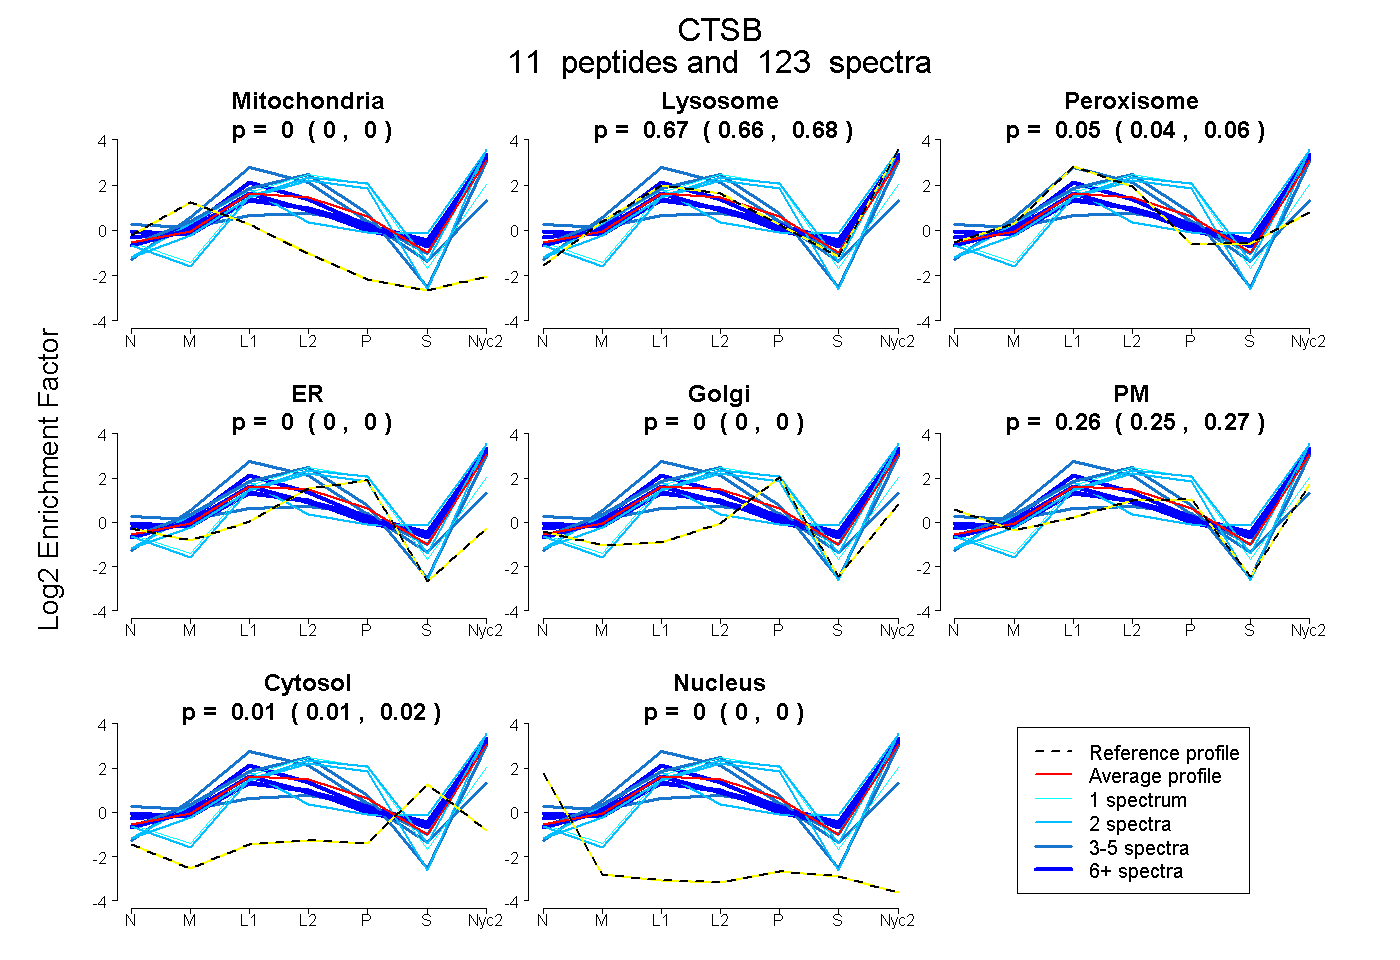
| Plot | Mito | Lyso | Perox | ER | Golgi | PM | Cytosol | Nucleus | |||||
| Expt A |
11 peptides |
123 spectra |
|
0.000 0.000 | 0.000 |
0.674 0.663 | 0.684 |
0.055 0.043 | 0.064 |
0.000 0.000 | 0.000 |
0.000 0.000 | 0.000 |
0.258 0.247 | 0.266 |
0.013 0.008 | 0.018 |
0.000 0.000 | 0.000 |
| 4 spectra, EQWSNCPTIAQIR | 0.000 | 0.829 | 0.171 | 0.000 | 0.000 | 0.000 | 0.000 | 0.000 | ||
| 8 spectra, EIMAEIYK | 0.000 | 0.720 | 0.000 | 0.000 | 0.000 | 0.179 | 0.102 | 0.000 | ||
| 12 spectra, GENHCGIESEIVAGIPR | 0.000 | 0.781 | 0.153 | 0.000 | 0.000 | 0.036 | 0.030 | 0.000 | ||
| 2 spectra, VGFSEDINLPESFDAR | 0.000 | 0.658 | 0.000 | 0.165 | 0.059 | 0.119 | 0.000 | 0.000 | ||
| 2 spectra, HYGYTSYSVSDSEK | 0.000 | 0.862 | 0.000 | 0.000 | 0.000 | 0.000 | 0.138 | 0.000 | ||
| 2 spectra, NFYNVDISYLK | 0.000 | 0.697 | 0.000 | 0.190 | 0.000 | 0.113 | 0.000 | 0.000 | ||
| 76 spectra, HEAGDVMGGHAIR | 0.000 | 0.618 | 0.011 | 0.000 | 0.000 | 0.284 | 0.087 | 0.000 | ||
| 1 spectrum, LCGTVLGGPK | 0.000 | 0.486 | 0.000 | 0.514 | 0.000 | 0.000 | 0.000 | 0.000 | ||
| 4 spectra, ICIHTNGR | 0.000 | 0.695 | 0.000 | 0.099 | 0.000 | 0.206 | 0.000 | 0.000 | ||
| 4 spectra, DQGSCGSCWAFGAVEAMSDR | 0.061 | 0.073 | 0.194 | 0.000 | 0.000 | 0.595 | 0.077 | 0.000 | ||
| 8 spectra, MCEAGYSTSYK | 0.000 | 0.806 | 0.000 | 0.000 | 0.000 | 0.091 | 0.102 | 0.000 |
| Plot | Mito | Lyso or Perox | ER | Golgi | PM | Cytosol | Nucleus | ||||||
| Expt B |
8 peptides |
39 spectra |
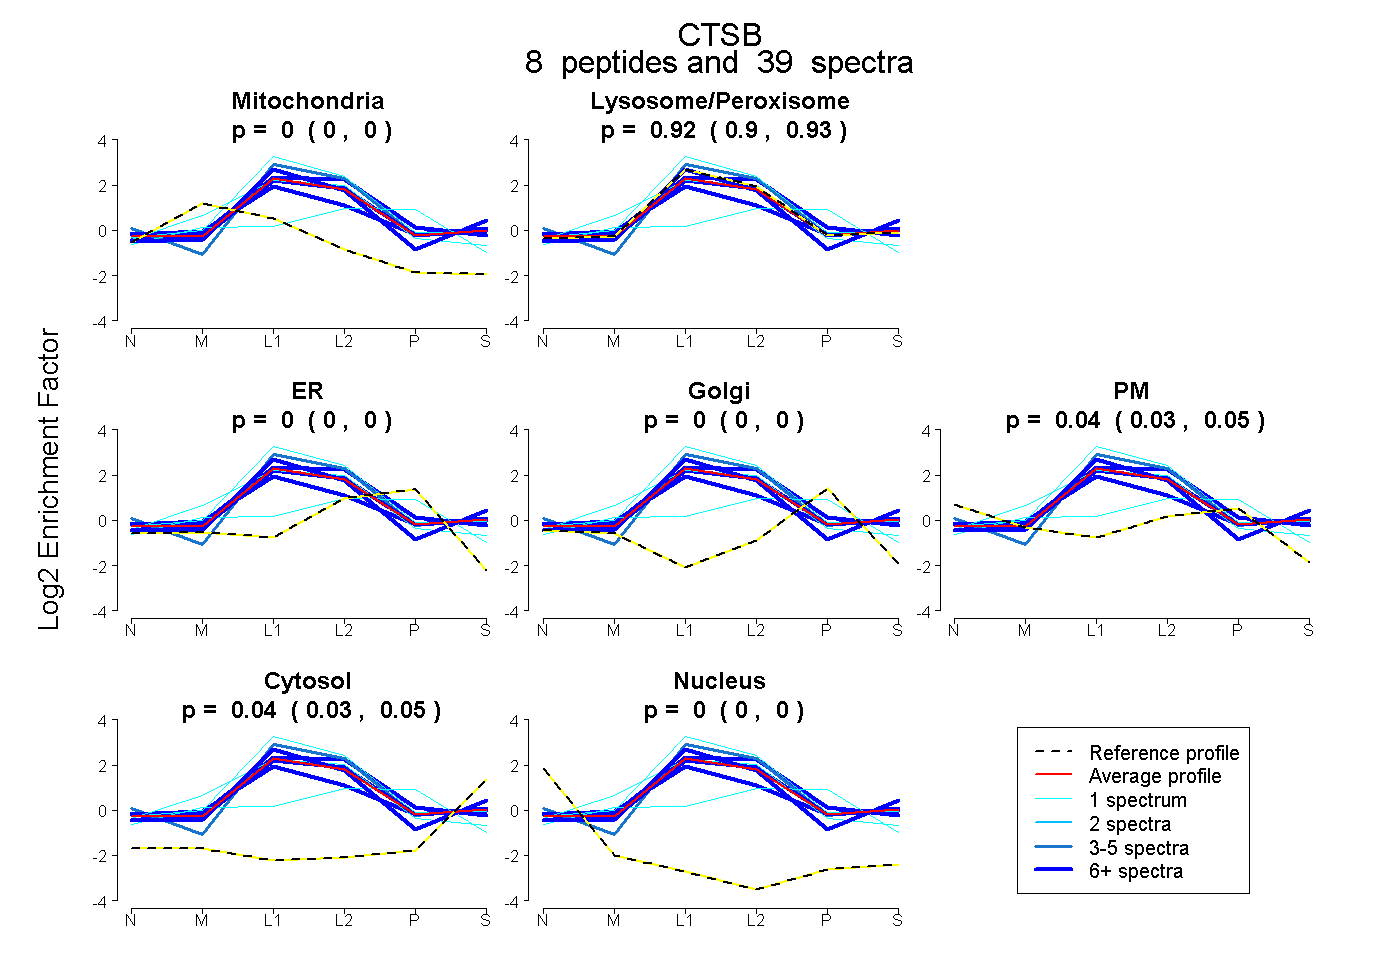 |
0.000 0.000 | 0.000 |
0.916 0.905 | 0.926 |
0.000 0.000 | 0.000 |
0.000 0.000 | 0.000 |
0.044 0.032 | 0.052 |
0.040 0.032 | 0.047 |
0.000 0.000 | 0.000 |
|||
| Plot | Lyso | Other | |||||||||||
| Expt C |
9 peptides |
225 spectra |
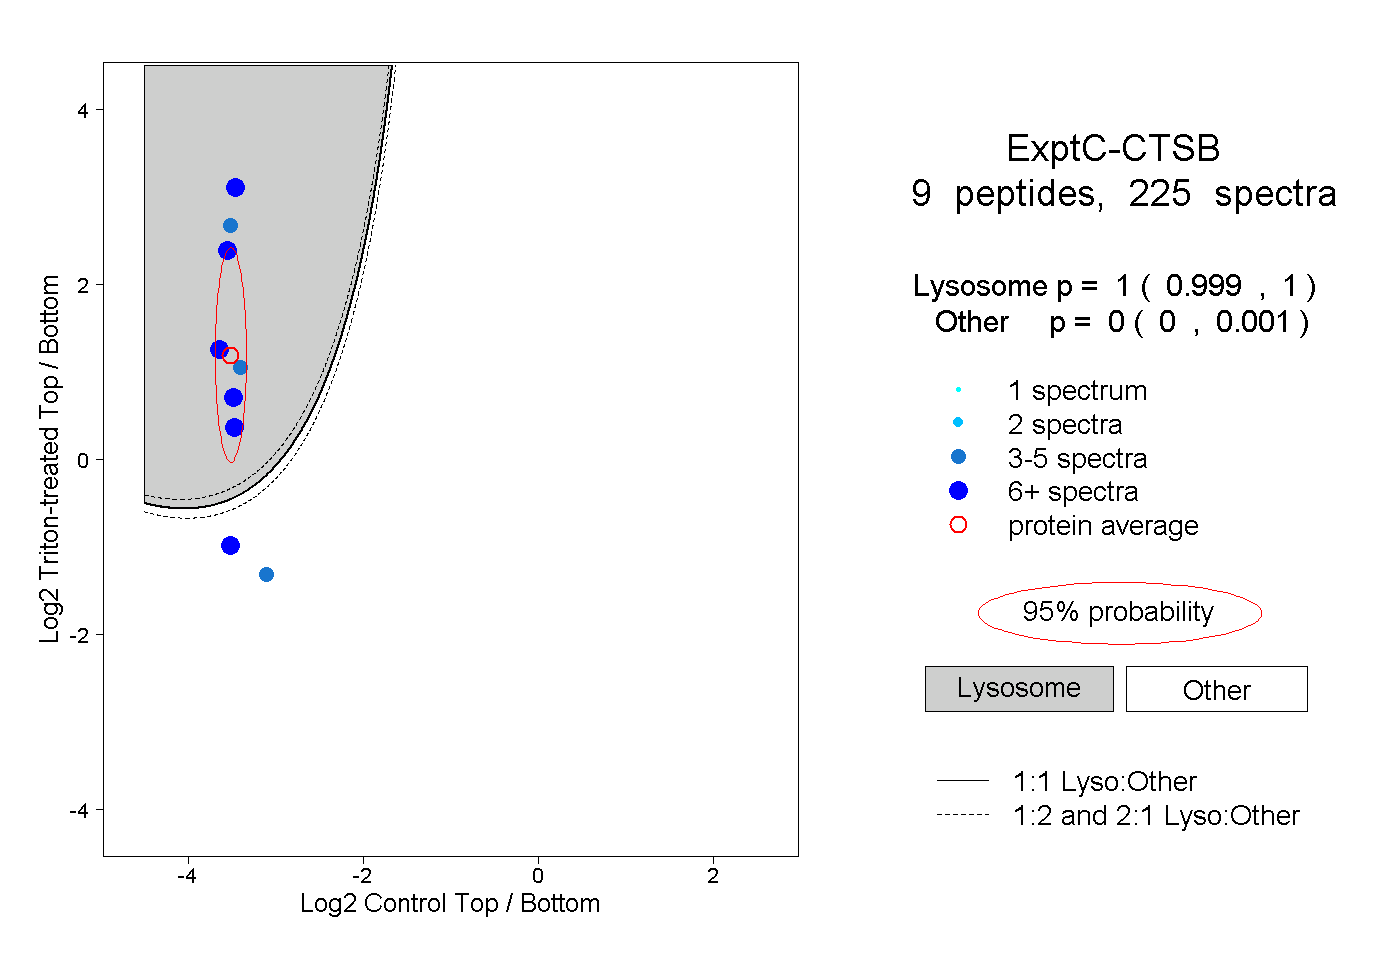 |
1.000 0.999 | 1.000 |
0.000 0.000 | 0.001 |
||||||||
| Plot | Lyso | Other | |||||||||||
| Expt D |
5 peptides |
7 spectra |
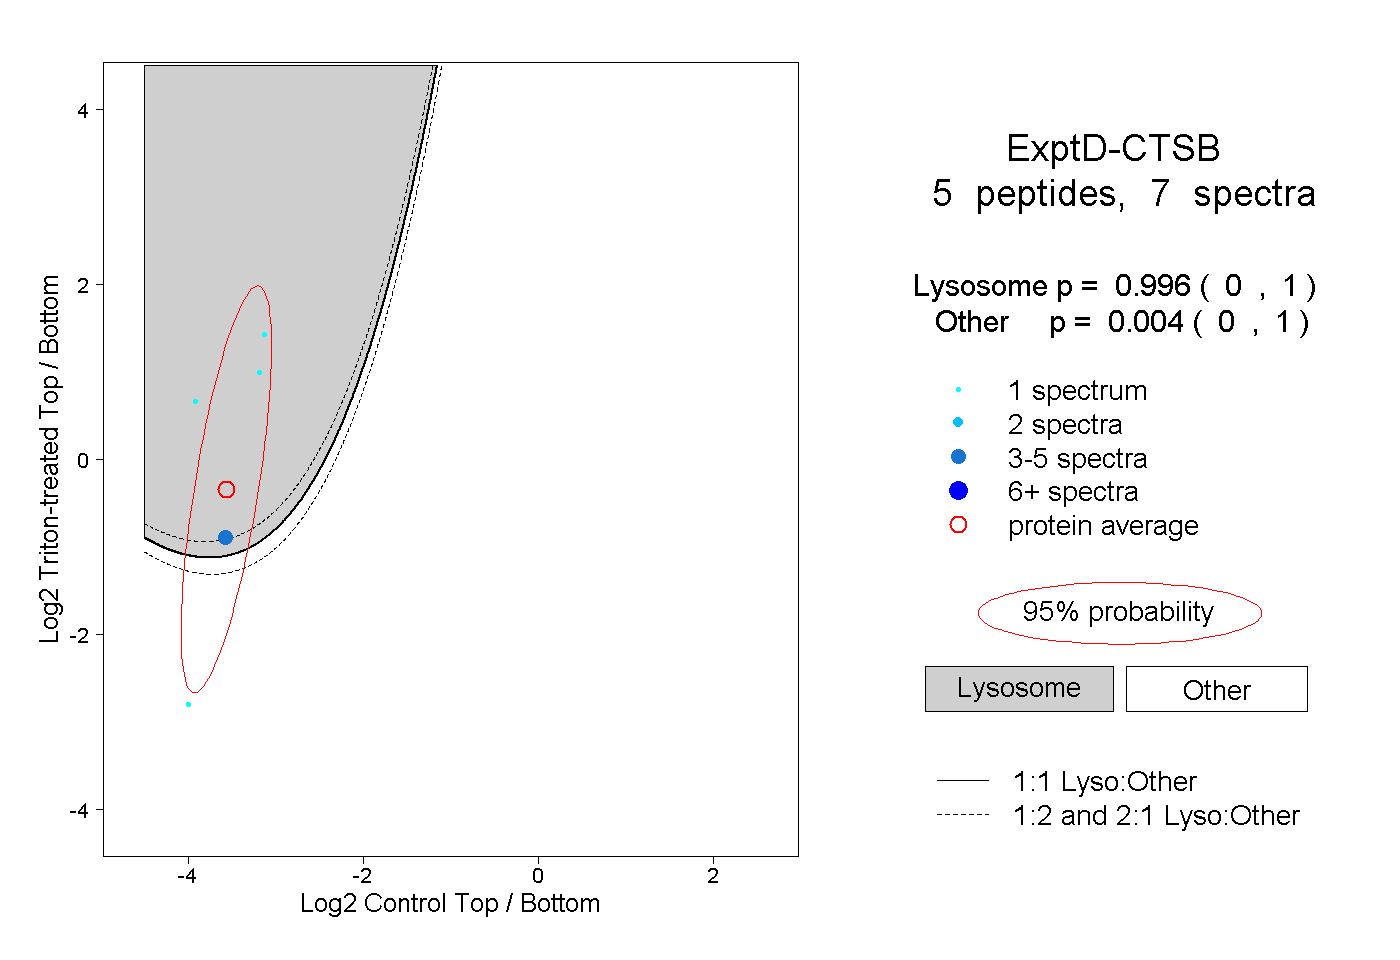 |
0.996 0.000 | 1.000 |
0.004 0.000 | 1.000 |