 26
26peptides
spectra
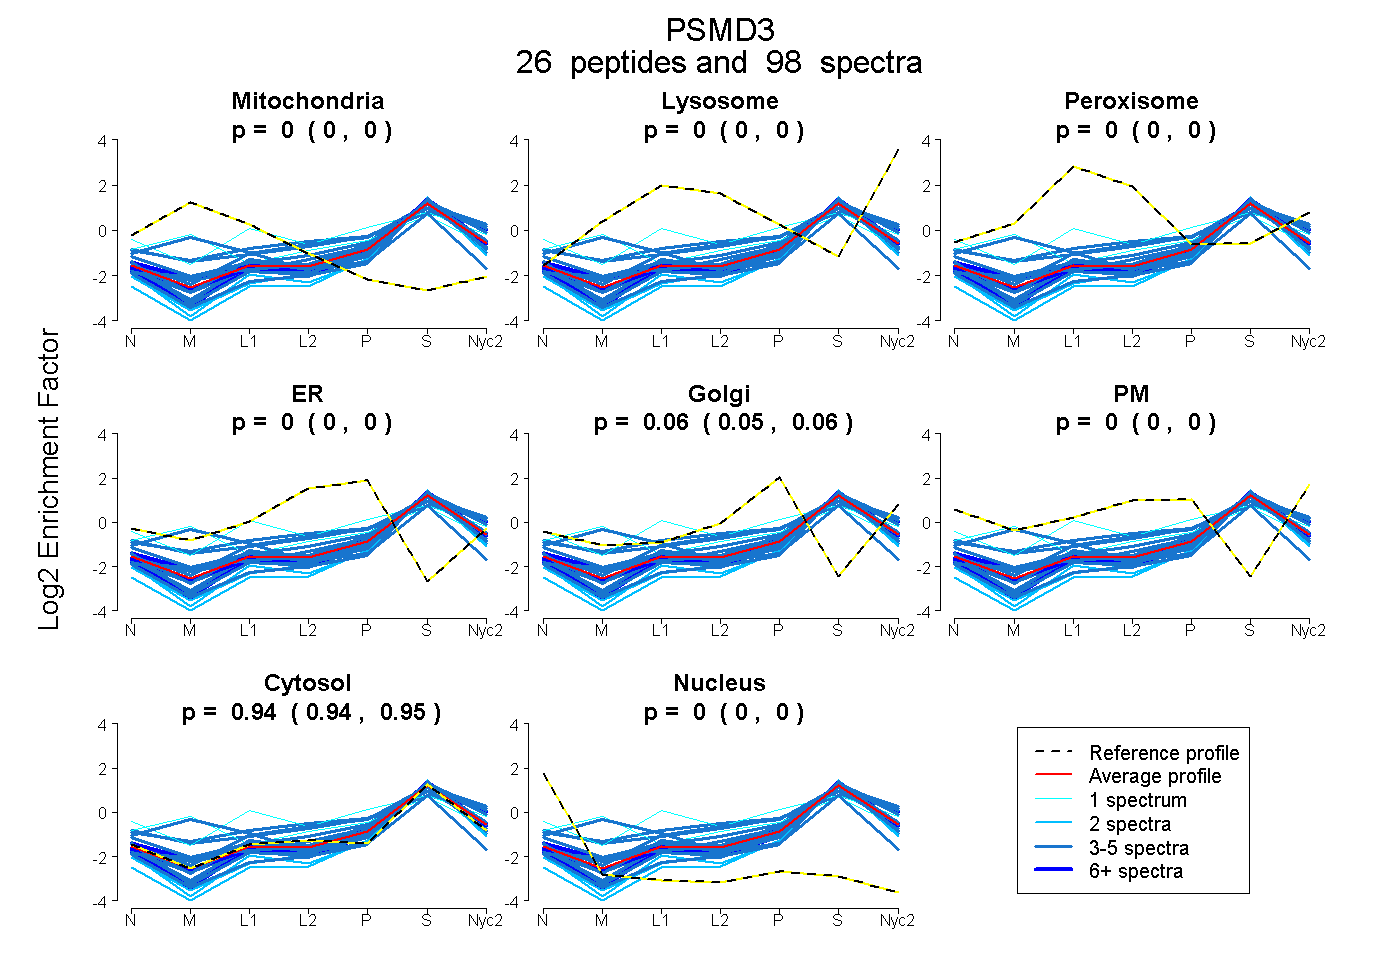
0.000 | 0.000
0.000 | 0.000
0.000 | 0.000
0.000 | 0.000
0.054 | 0.058
0.000 | 0.000
0.941 | 0.946
0.000 | 0.000
15peptides
spectra
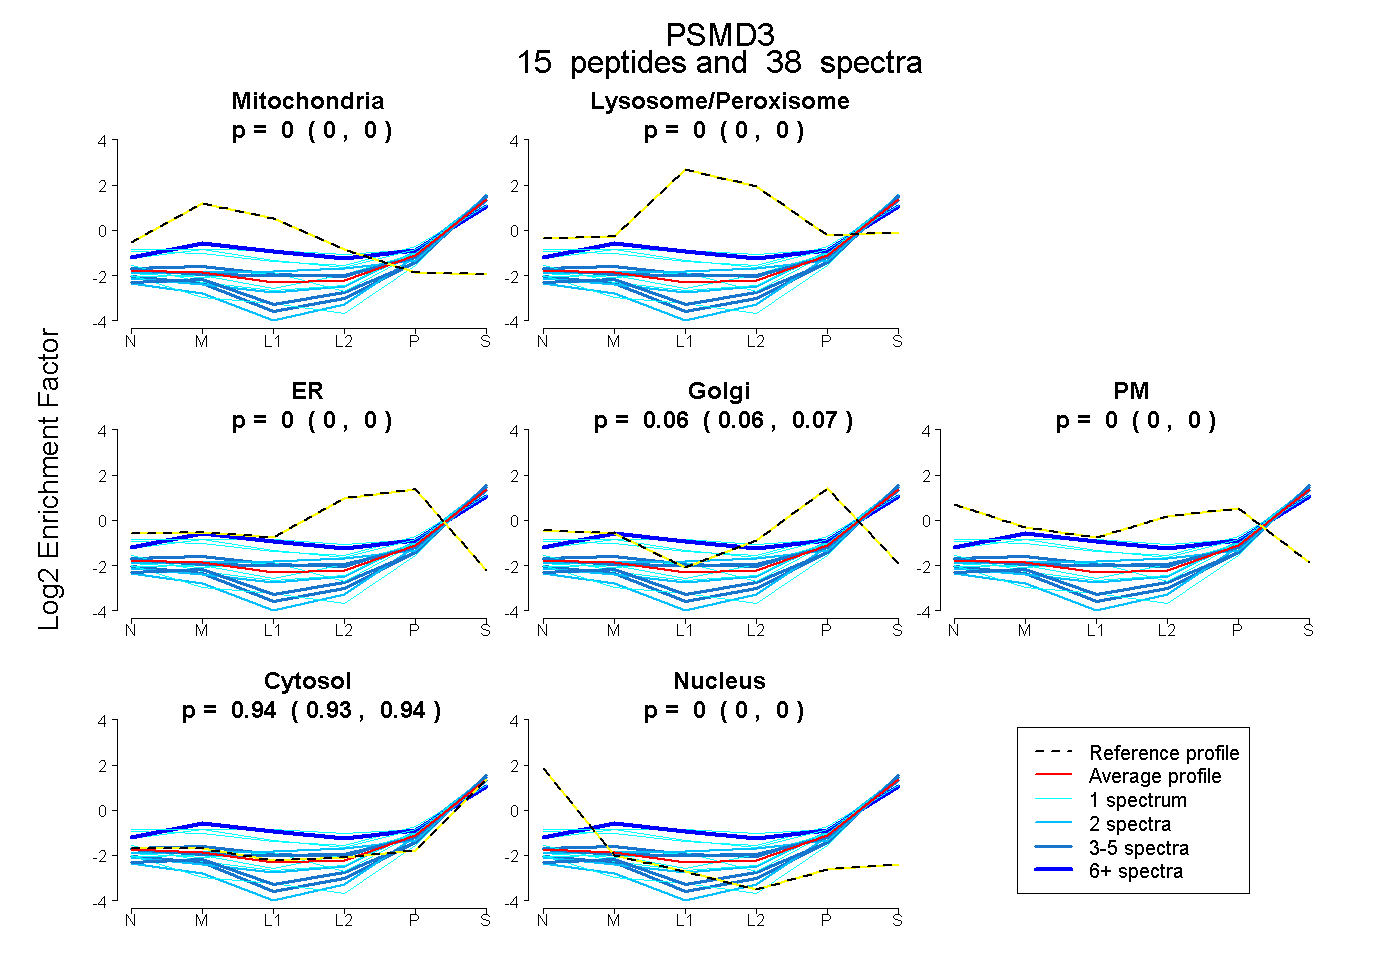
0.000 | 0.000
0.000 | 0.000
0.000 | 0.000
0.057 | 0.068
0.000 | 0.000
0.931 | 0.942
0.000 | 0.000
24peptides
spectra
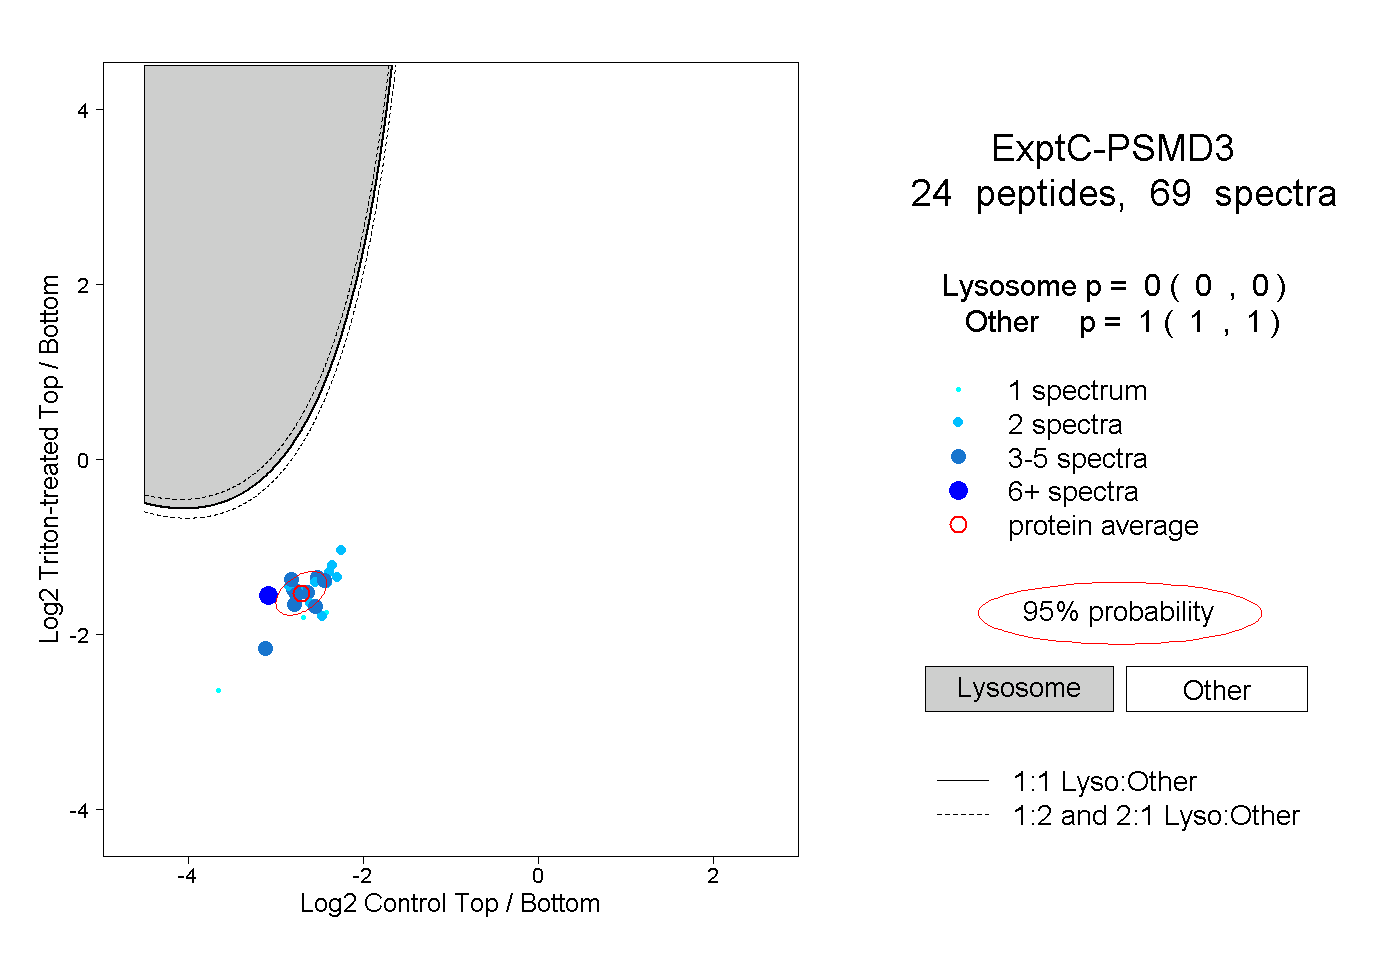
0.000 | 0.000
1.000 | 1.000
4peptides
spectra
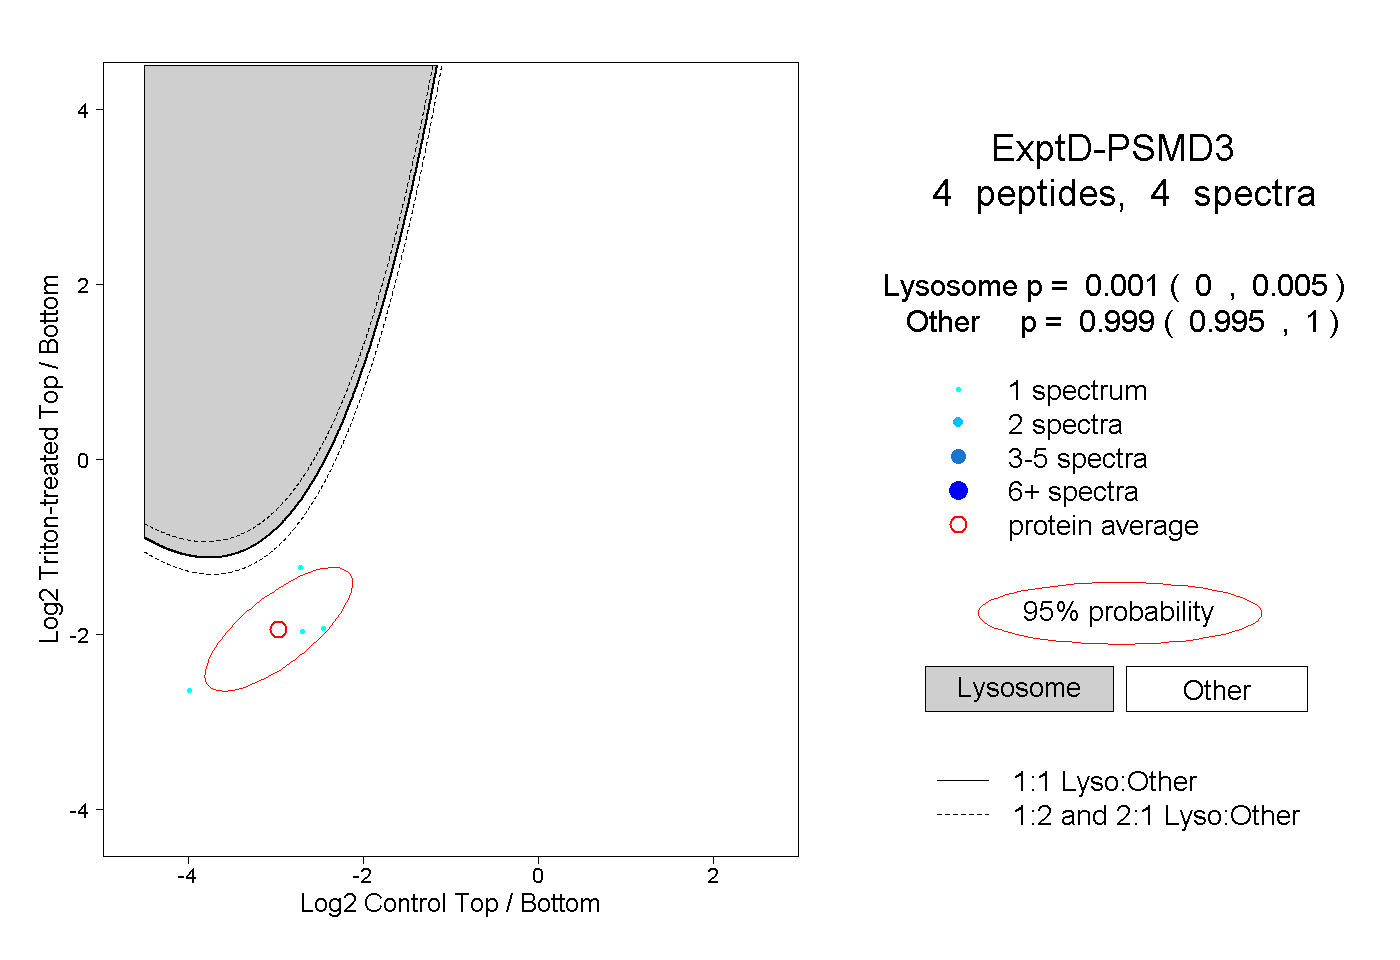
0.000 | 0.005
0.995 | 1.000