 7
7peptides
spectra
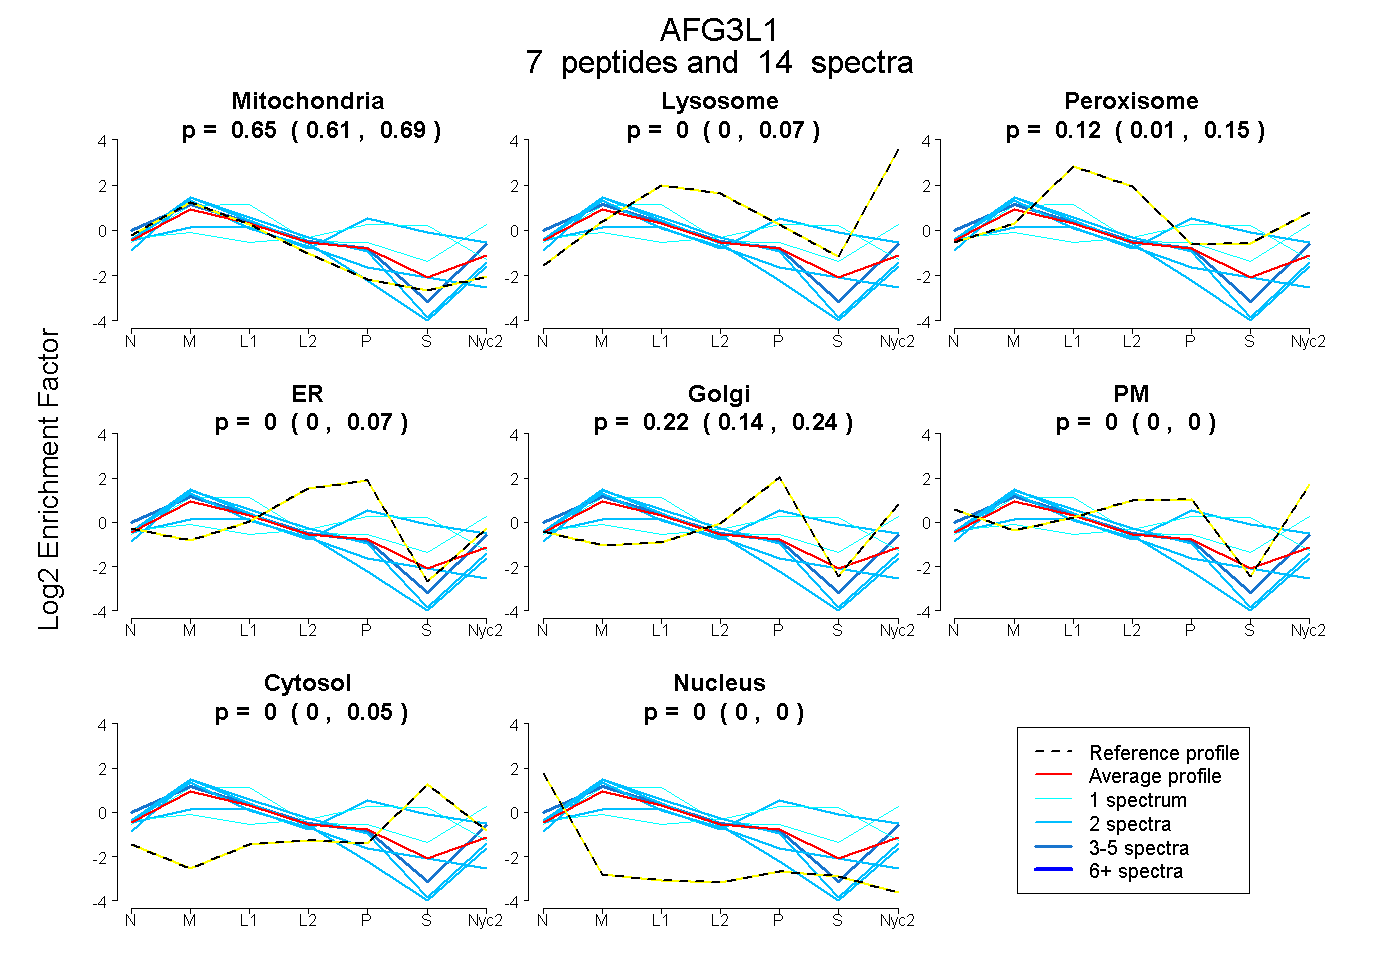
0.605 | 0.689
0.000 | 0.068
0.011 | 0.149
0.000 | 0.068
0.135 | 0.239
0.000 | 0.000
0.000 | 0.047
0.000 | 0.000
2peptides
spectra
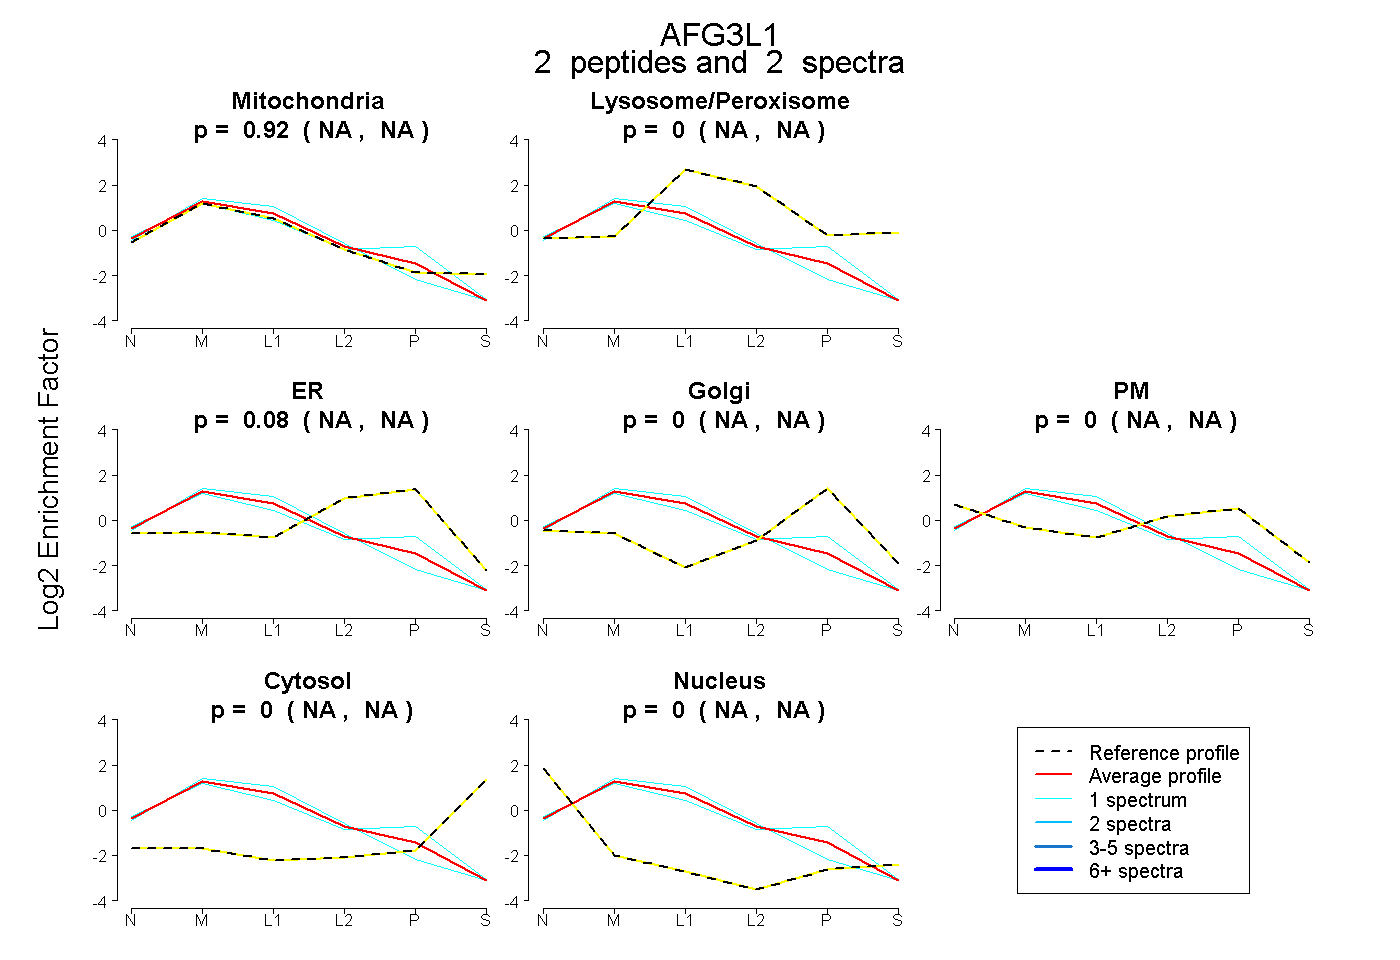
NA | NA
NA | NA
NA | NA
NA | NA
NA | NA
NA | NA
NA | NA
18peptides
spectra
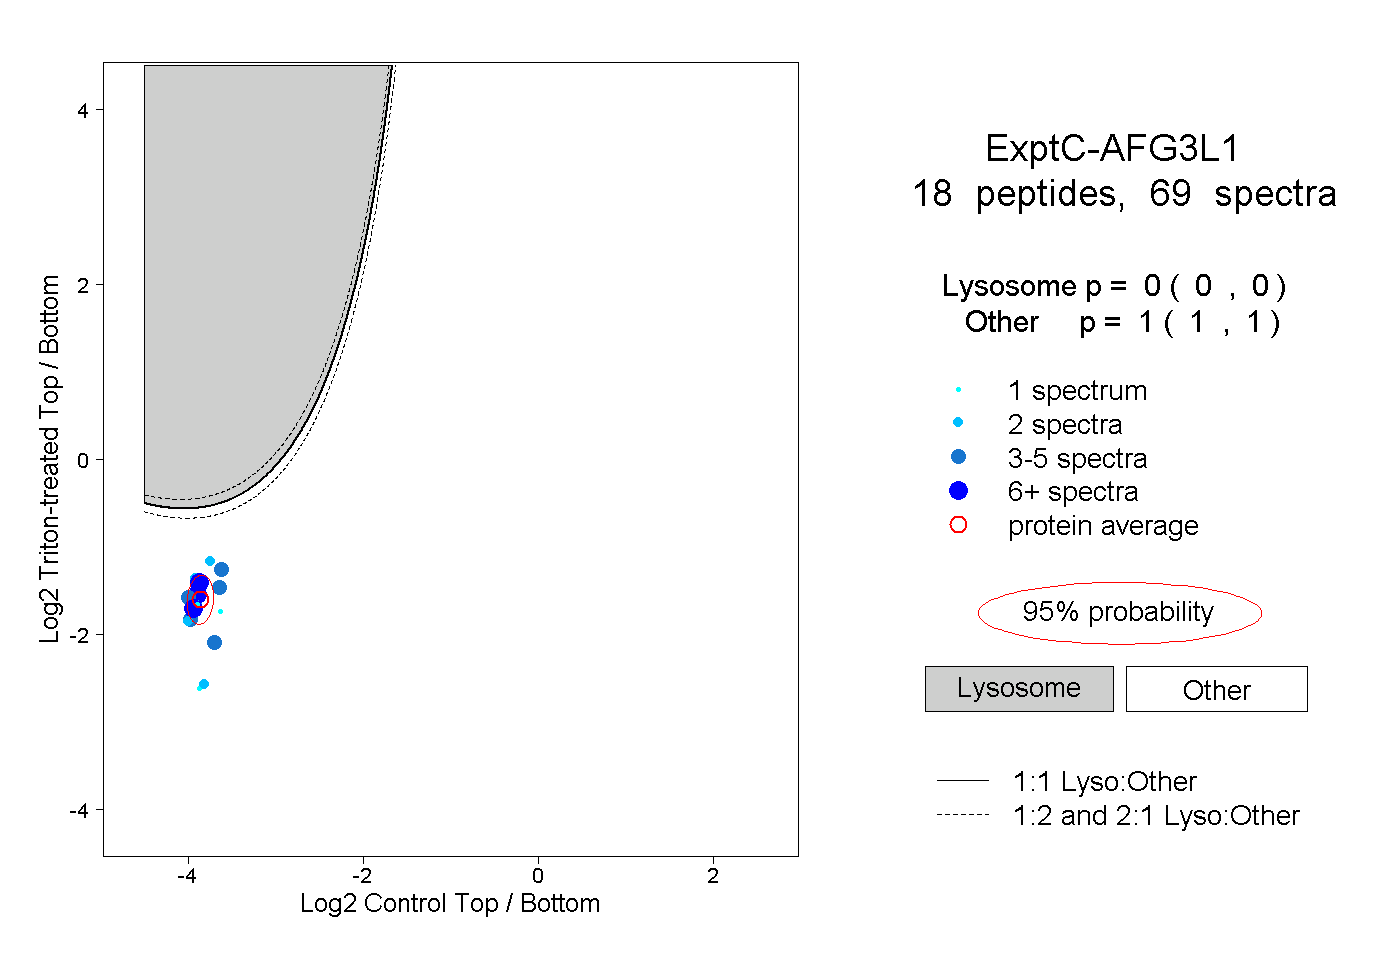
0.000 | 0.000
1.000 | 1.000
2peptides
spectra
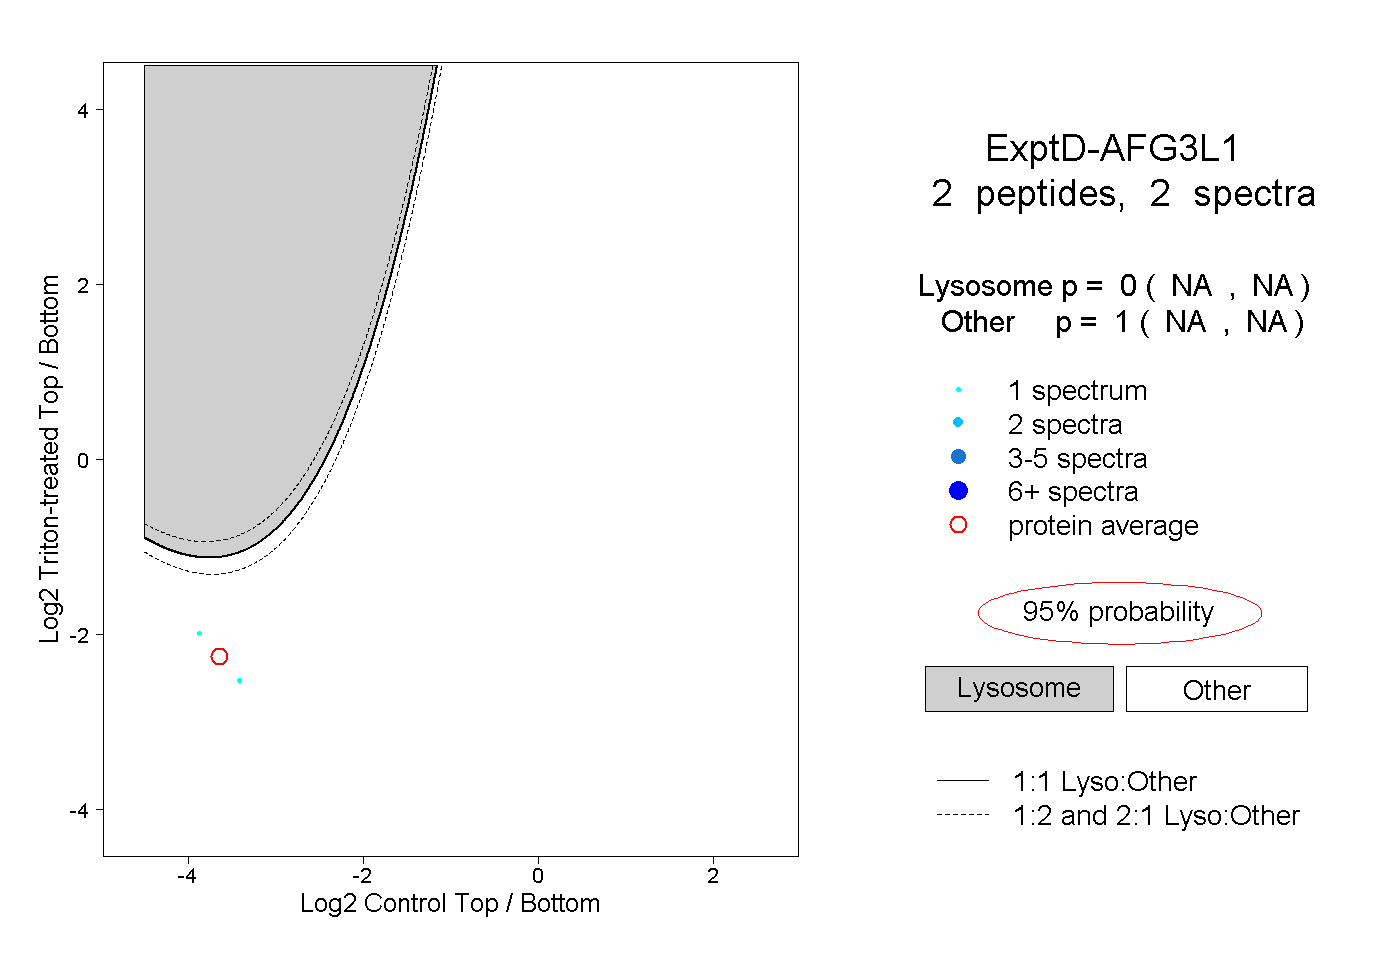
NA | NA
NA | NA