 2
2peptides
spectra
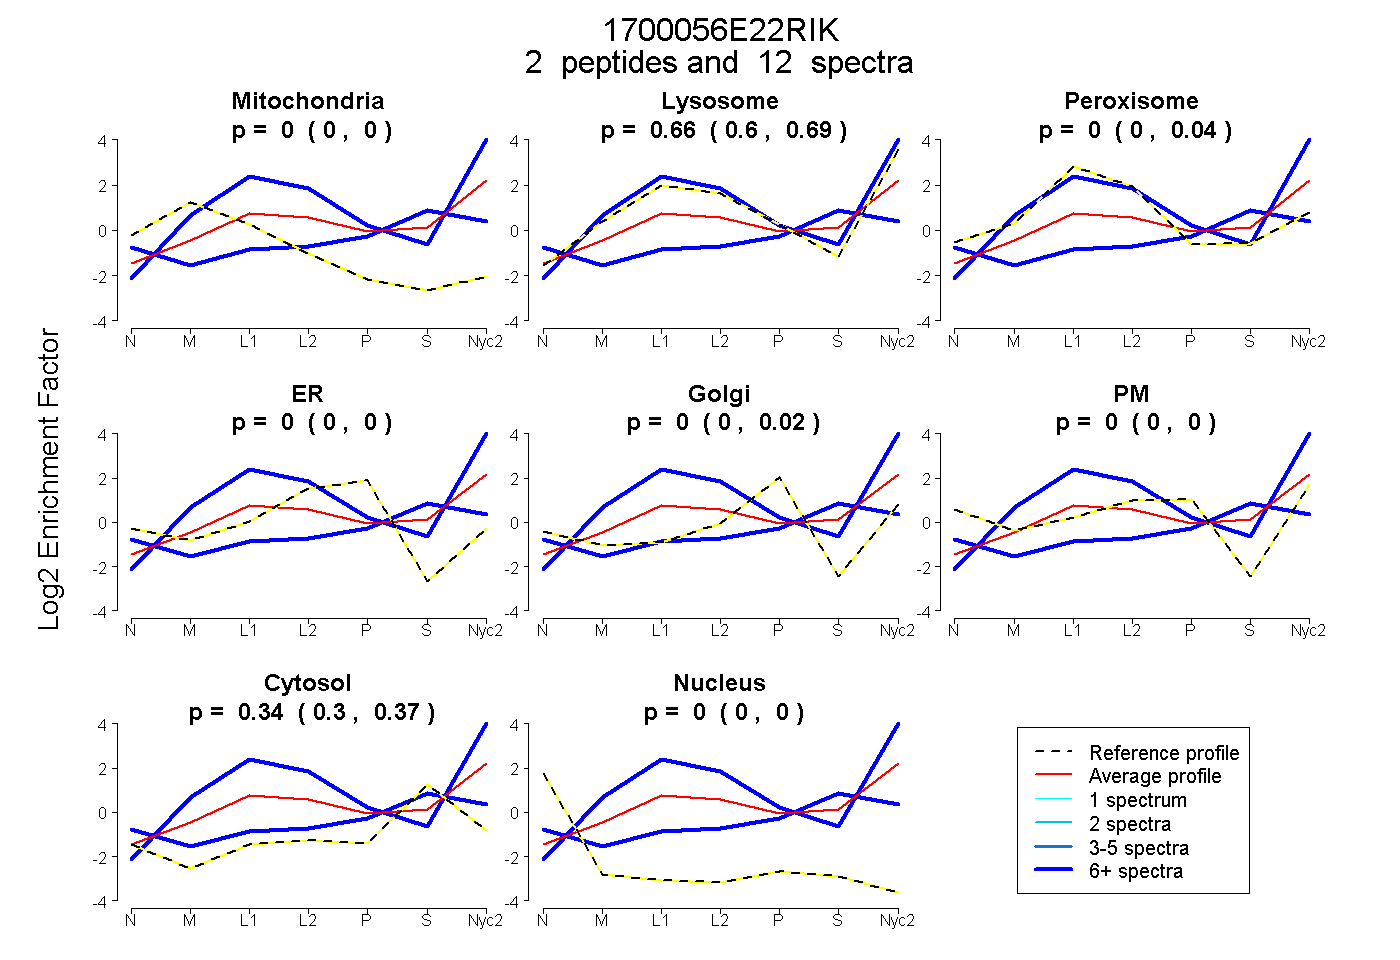
0.000 | 0.000
0.599 | 0.687
0.000 | 0.041
0.000 | 0.000
0.000 | 0.016
0.000 | 0.000
0.304 | 0.369
0.000 | 0.000
2peptides
spectra
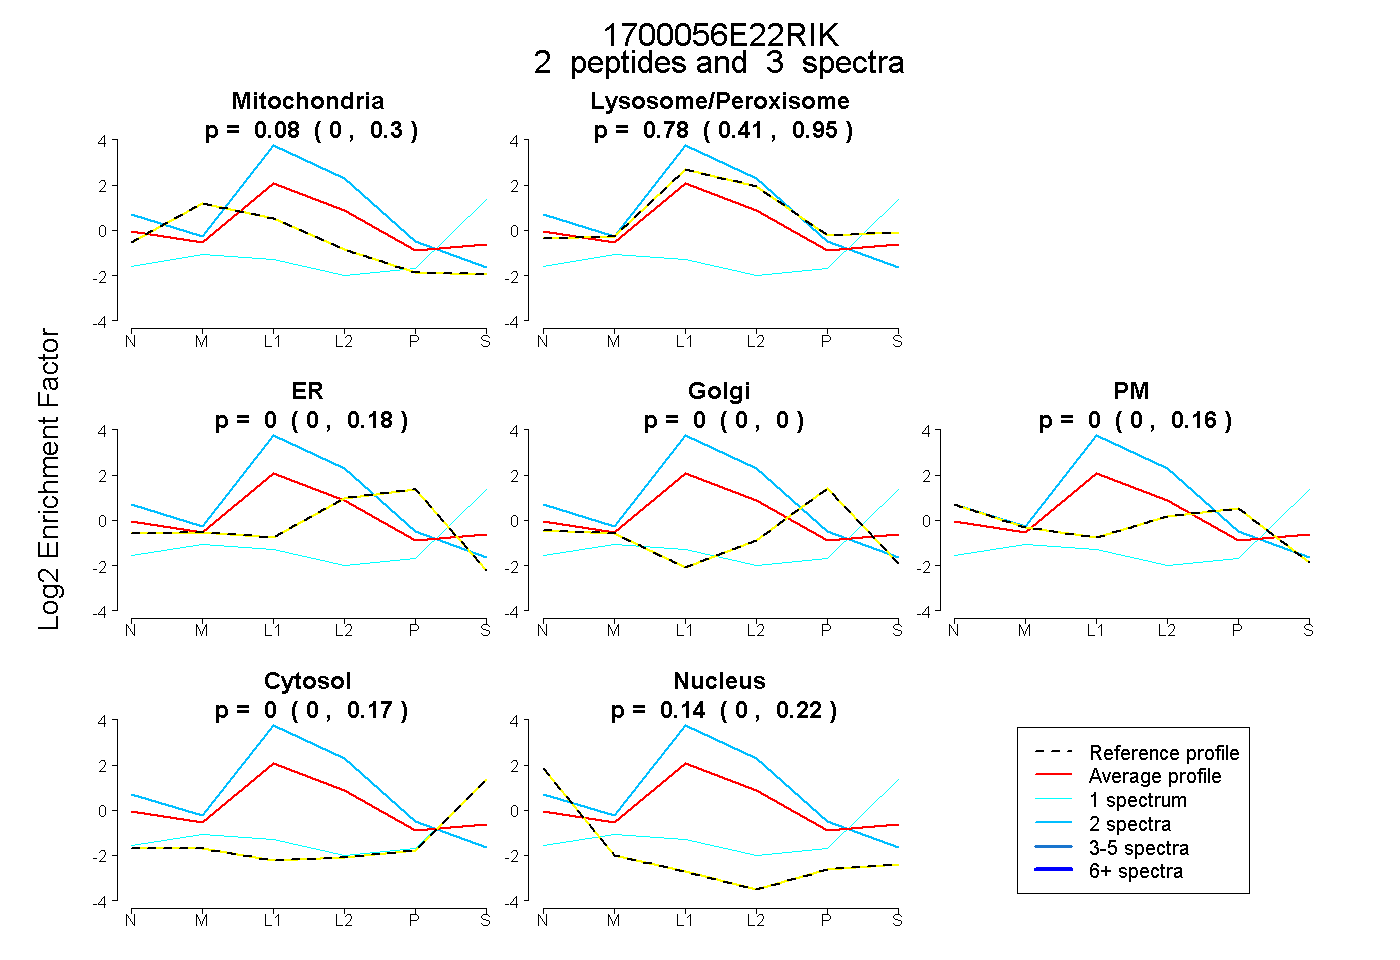
0.000 | 0.296
0.407 | 0.945
0.000 | 0.185
0.000 | 0.000
0.000 | 0.157
0.000 | 0.175
0.000 | 0.223
1peptide
spectra
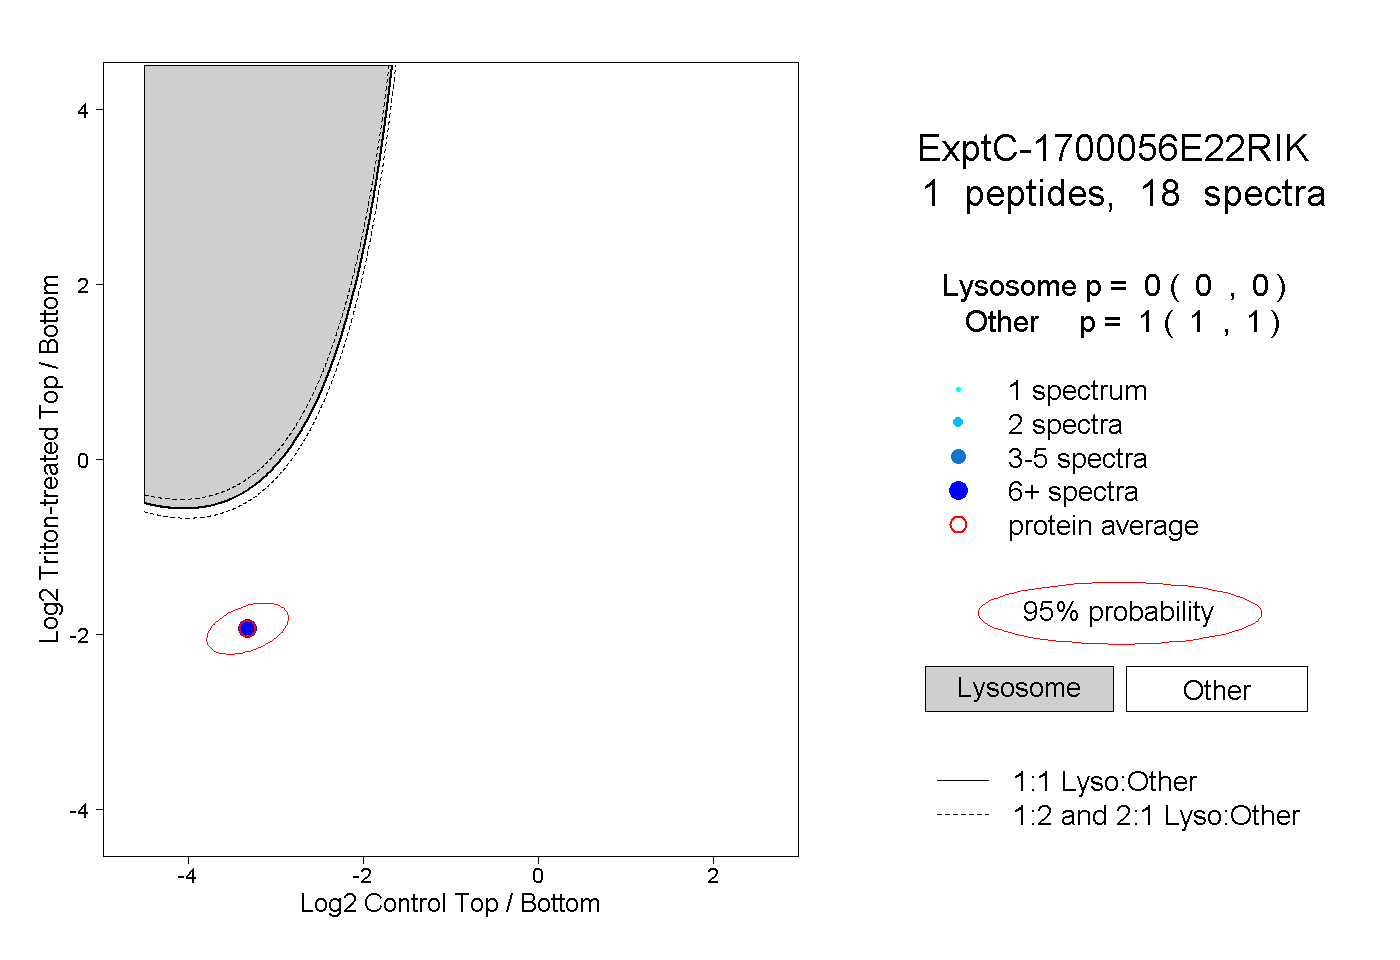
0.000 | 0.000
1.000 | 1.000
1peptide
spectra
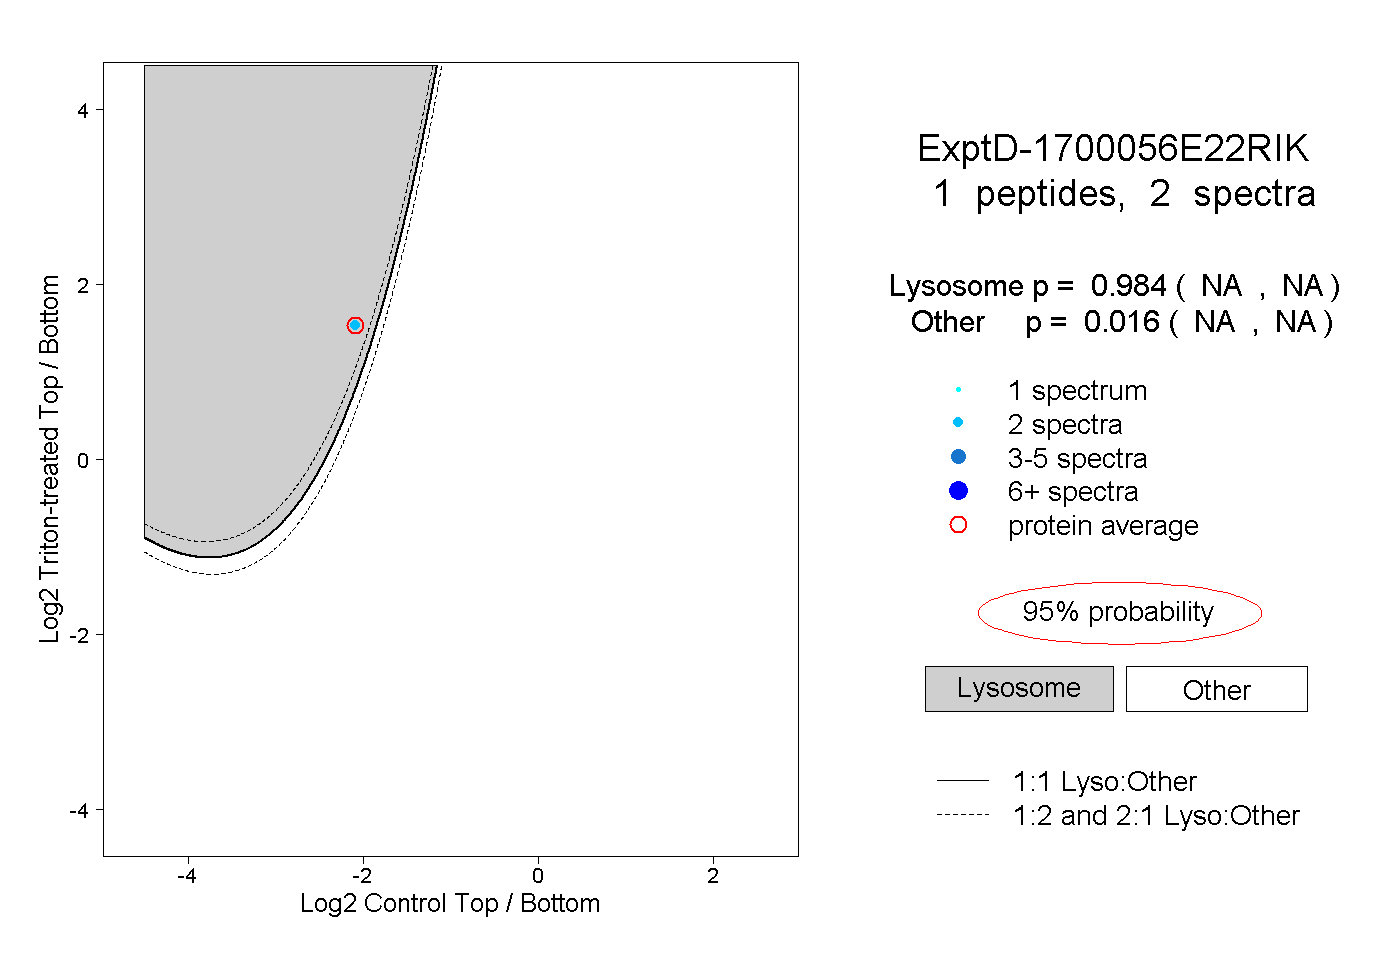
NA | NA
NA | NA