 1
1peptide
spectrum
NA | NA
NA | NA
NA | NA
NA | NA
NA | NA
NA | NA
NA | NA
NA | NA
4peptides
spectra
0.157 | 1.000
0.000 | 0.840
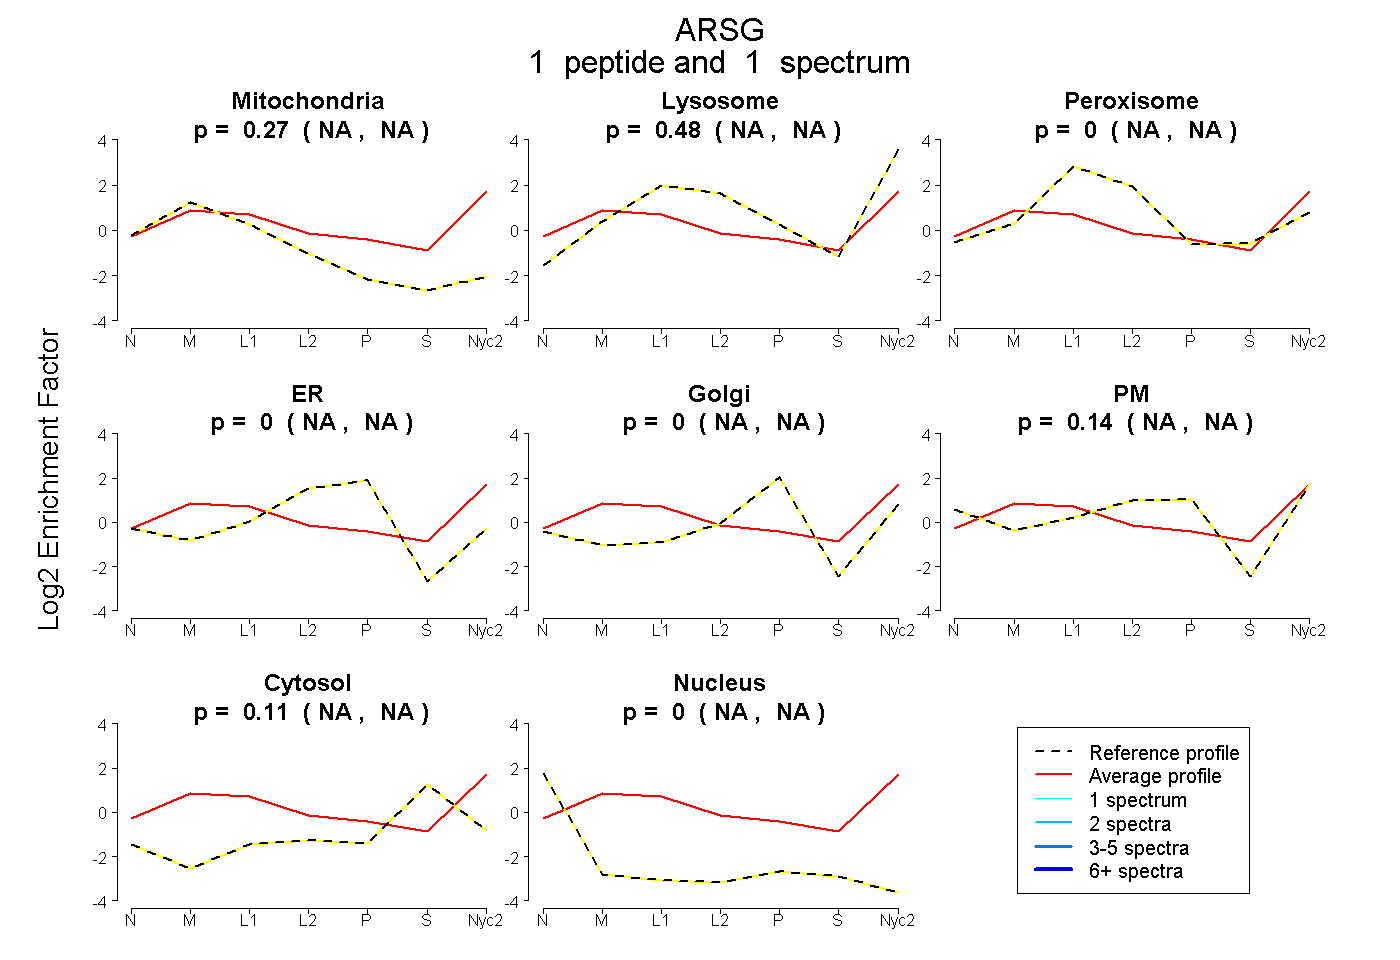
| Plot | Mito | Lyso | Perox | ER | Golgi | PM | Cytosol | Nucleus | |||||
| Expt A |
1 peptide |
1 spectrum |
|
0.269 NA | NA |
0.481 NA | NA |
0.000 NA | NA |
0.000 NA | NA |
0.000 NA | NA |
0.136 NA | NA |
0.114 NA | NA |
0.000 NA | NA |
||
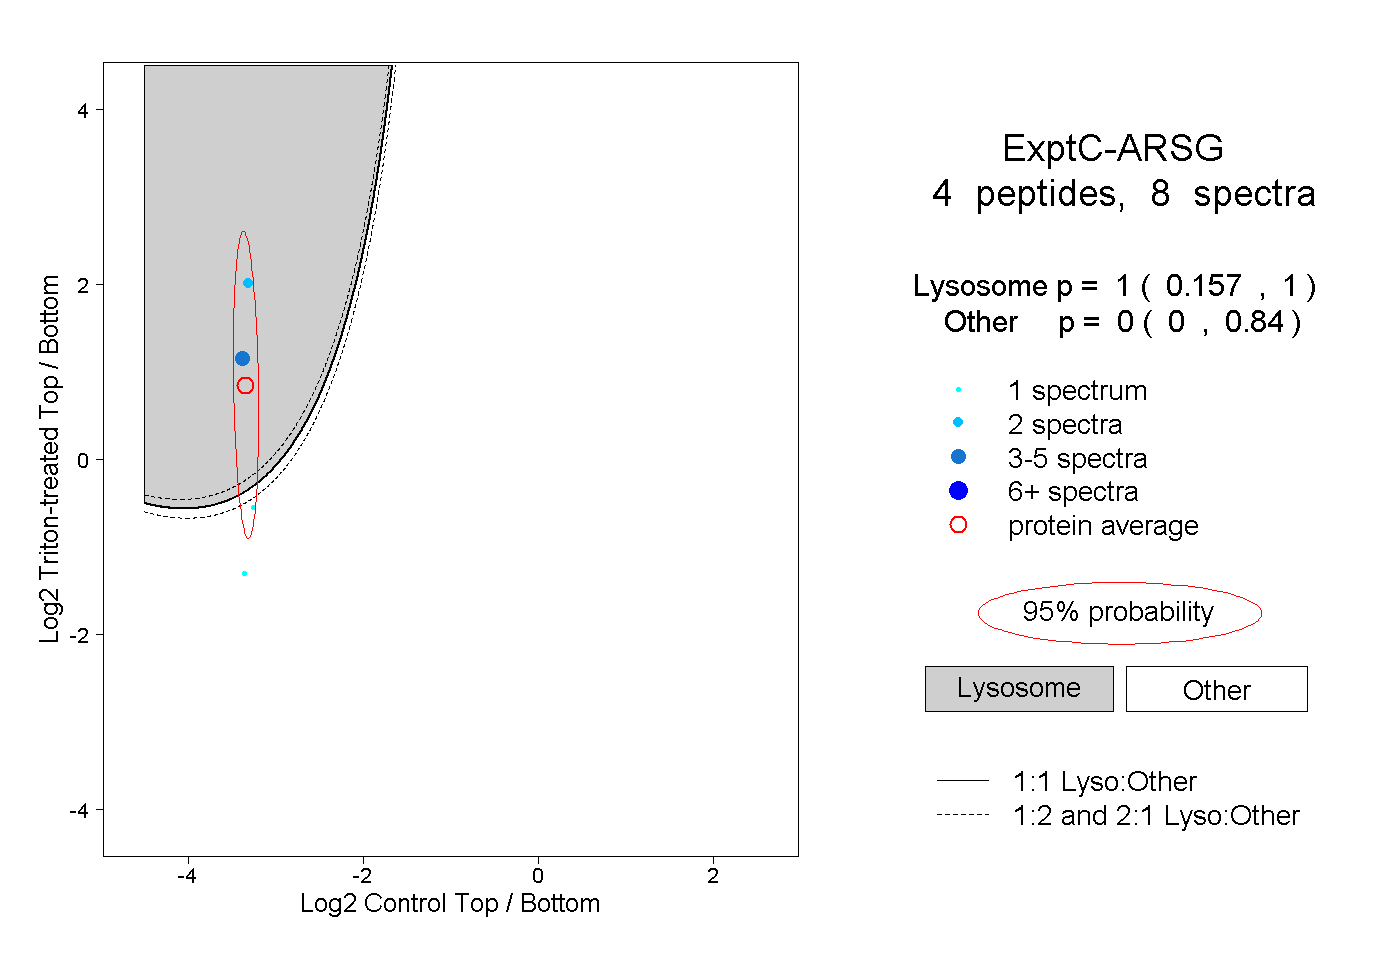
| Plot | Lyso | Other | |||||||||||
| Expt C |
4 peptides |
8 spectra |
|
1.000 0.157 | 1.000 |
0.000 0.000 | 0.840 |