 15
15peptides
spectra
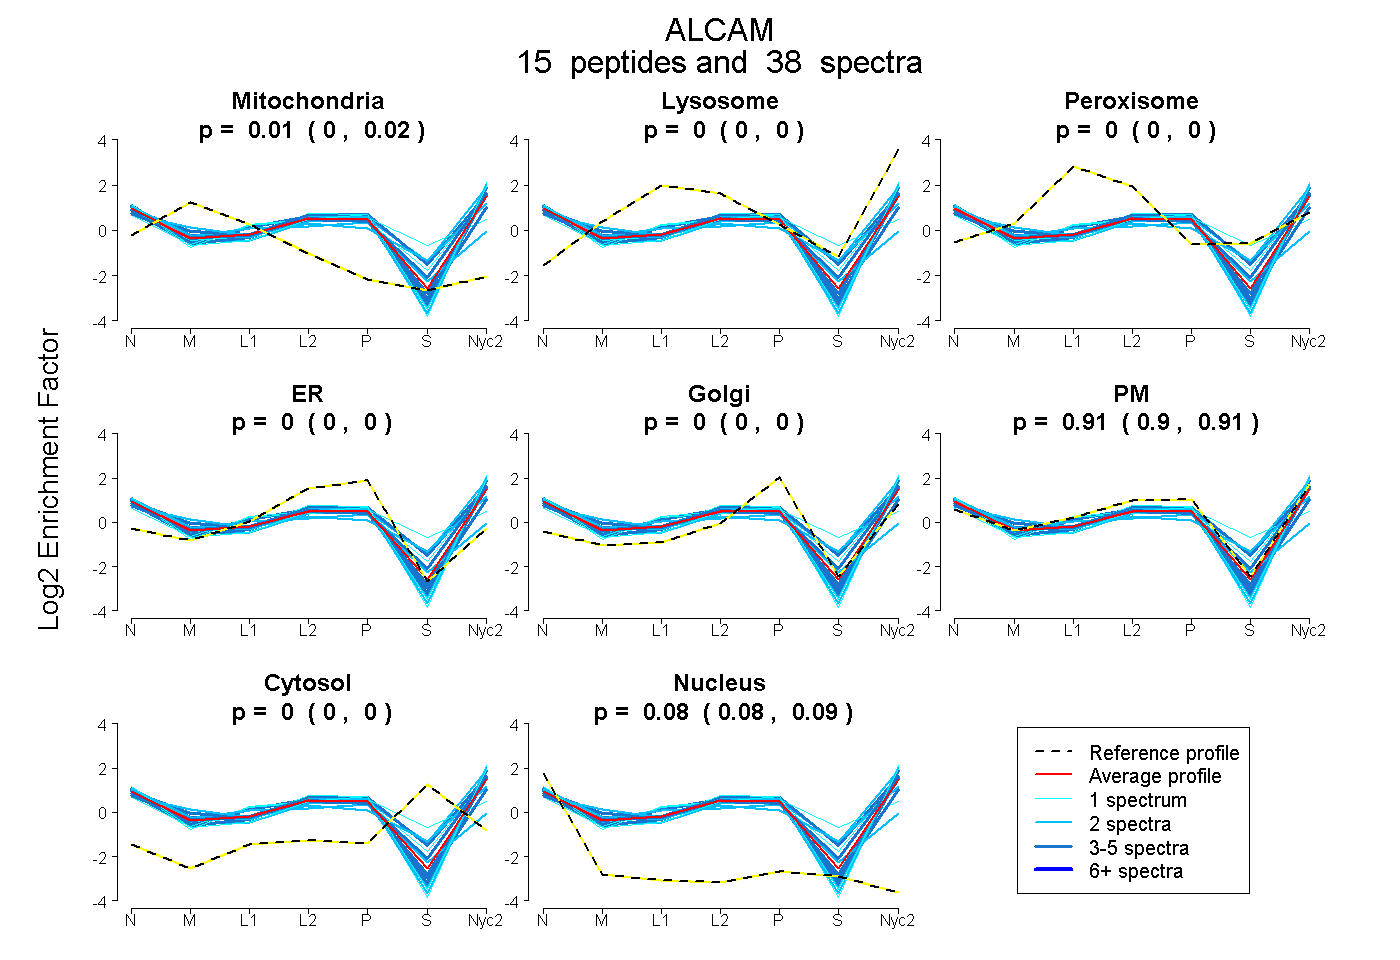
0.005 | 0.016
0.000 | 0.000
0.000 | 0.000
0.000 | 0.000
0.000 | 0.000
0.901 | 0.911
0.000 | 0.000
0.079 | 0.085
3peptides
spectra
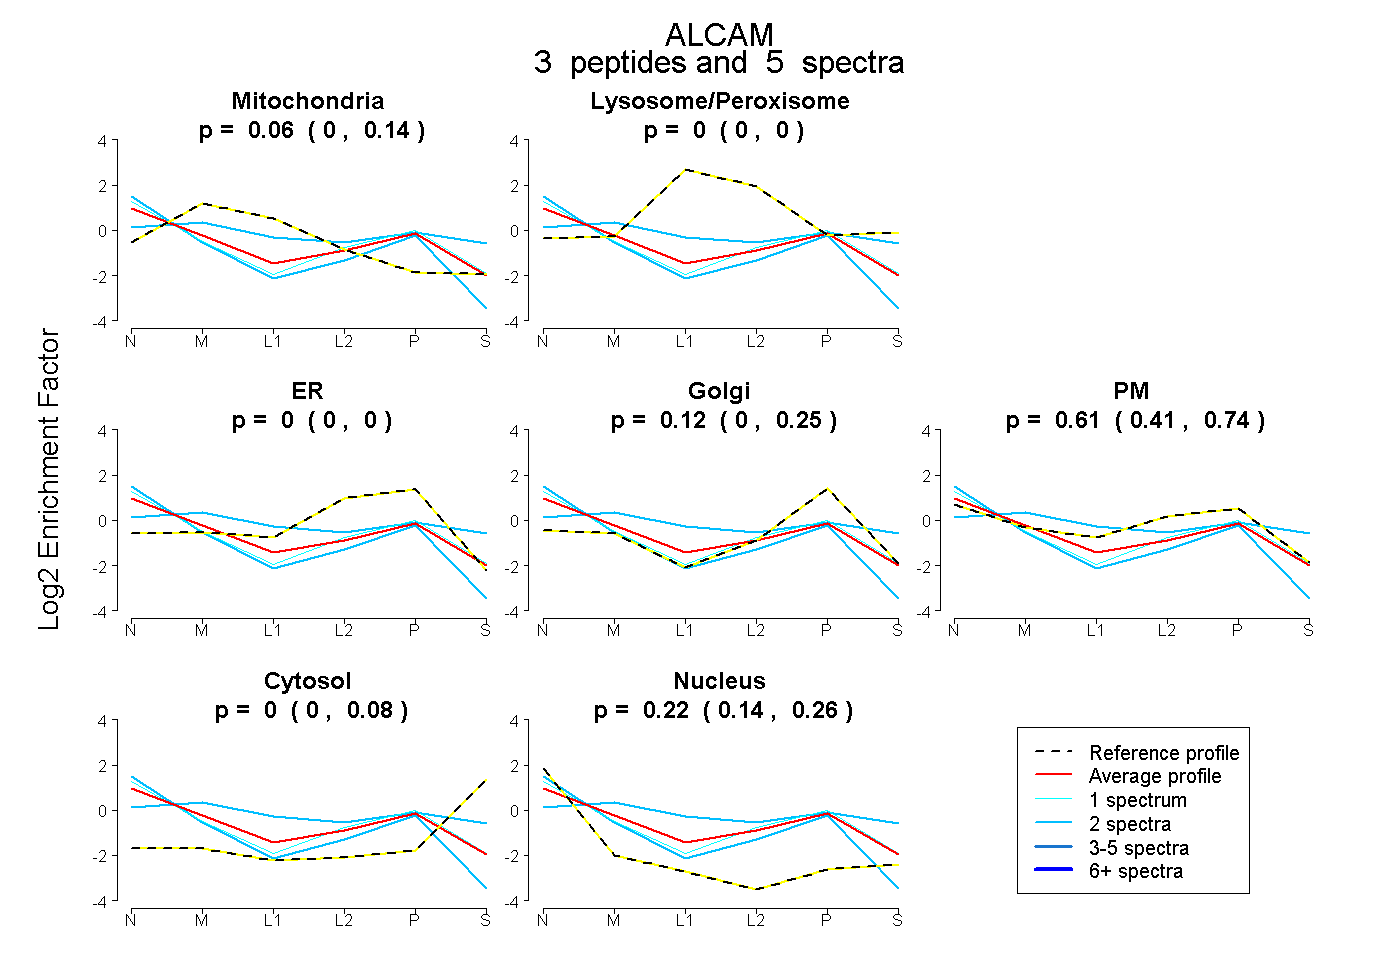
0.000 | 0.143
0.000 | 0.000
0.000 | 0.000
0.000 | 0.251
0.406 | 0.738
0.000 | 0.081
0.141 | 0.262
15peptides
spectra
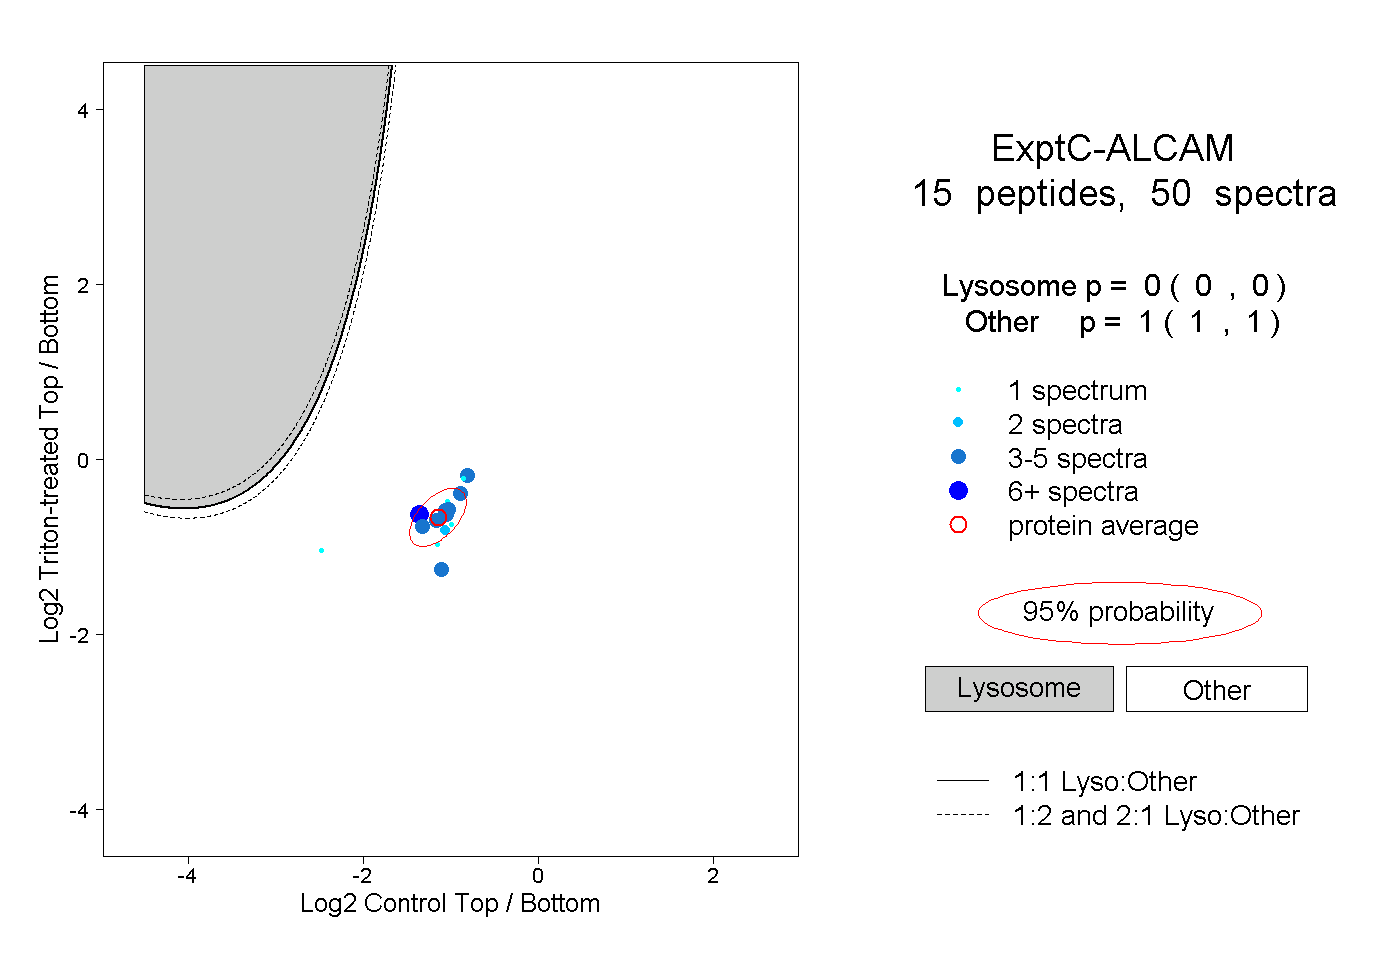
0.000 | 0.000
1.000 | 1.000
2peptides
spectra
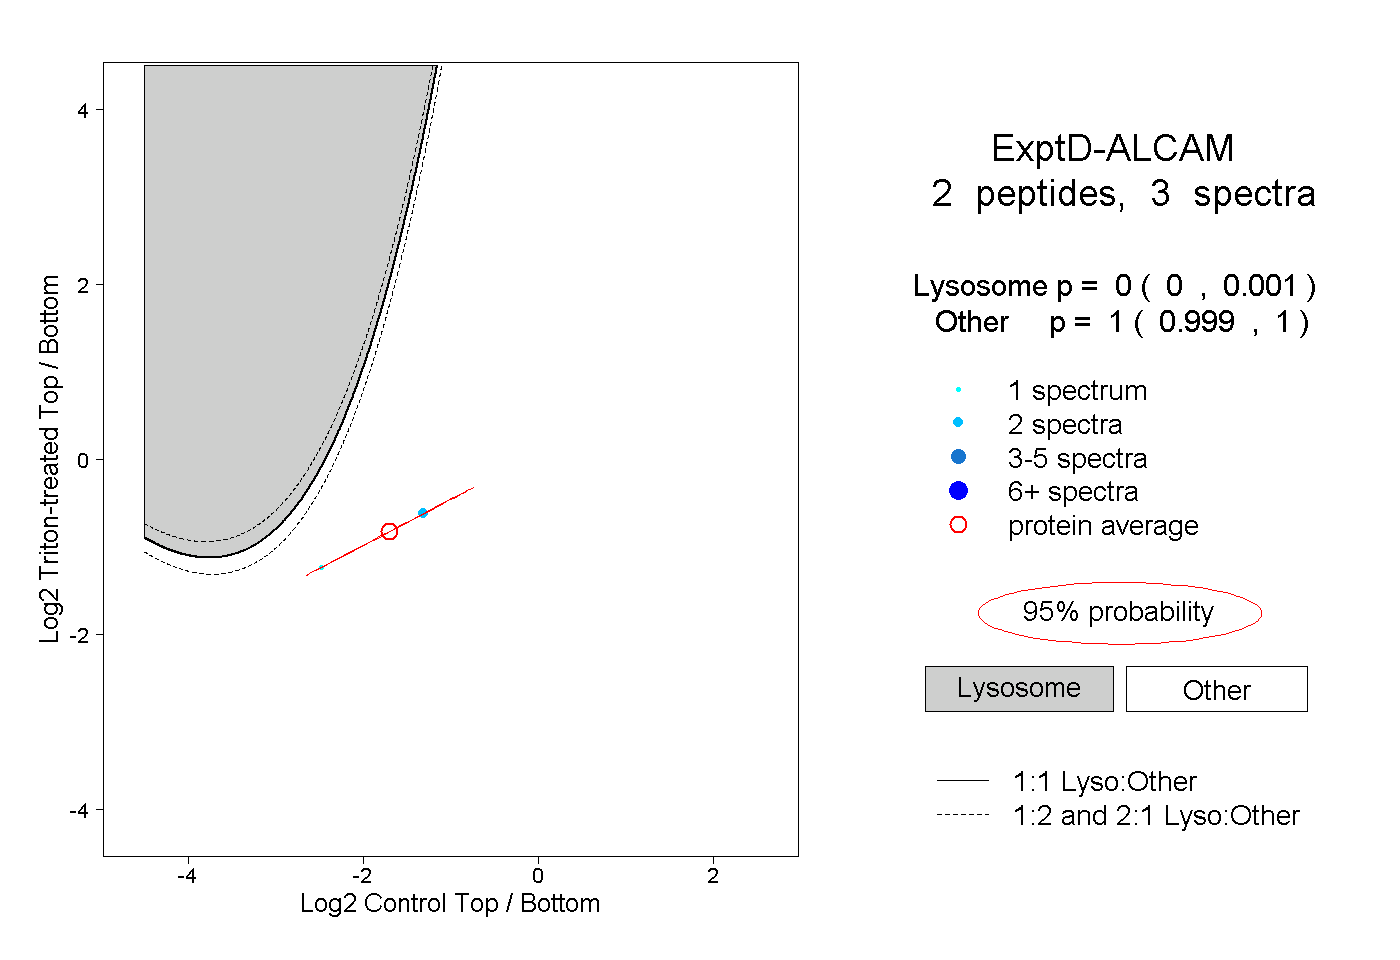
0.000 | 0.001
0.999 | 1.000