 2
2peptides
spectra
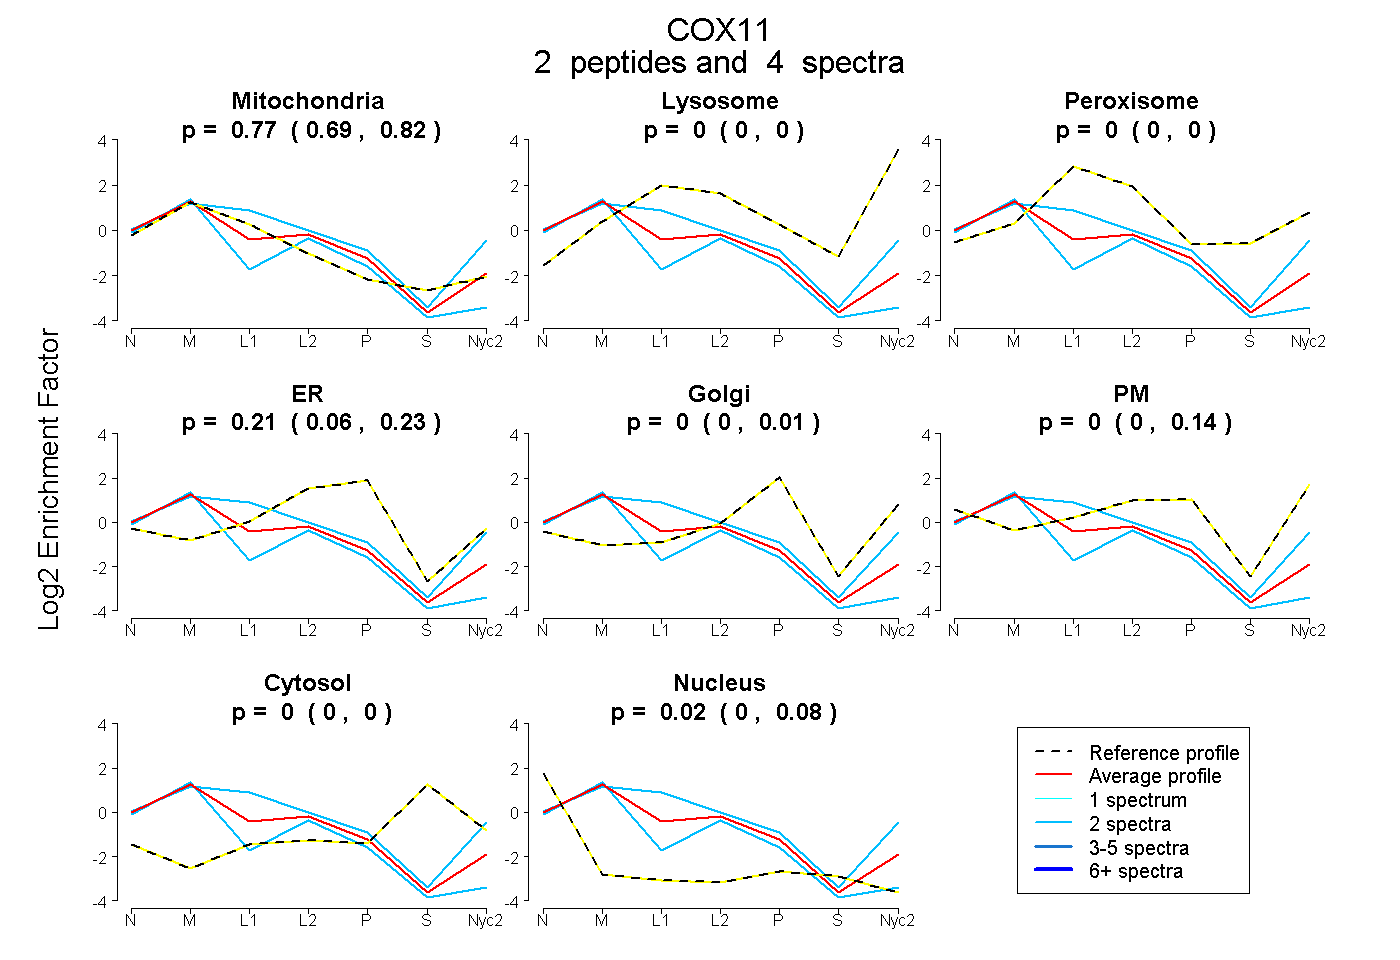
0.691 | 0.821
0.000 | 0.000
0.000 | 0.000
0.060 | 0.231
0.000 | 0.011
0.000 | 0.139
0.000 | 0.000
0.000 | 0.080
1peptide
spectrum
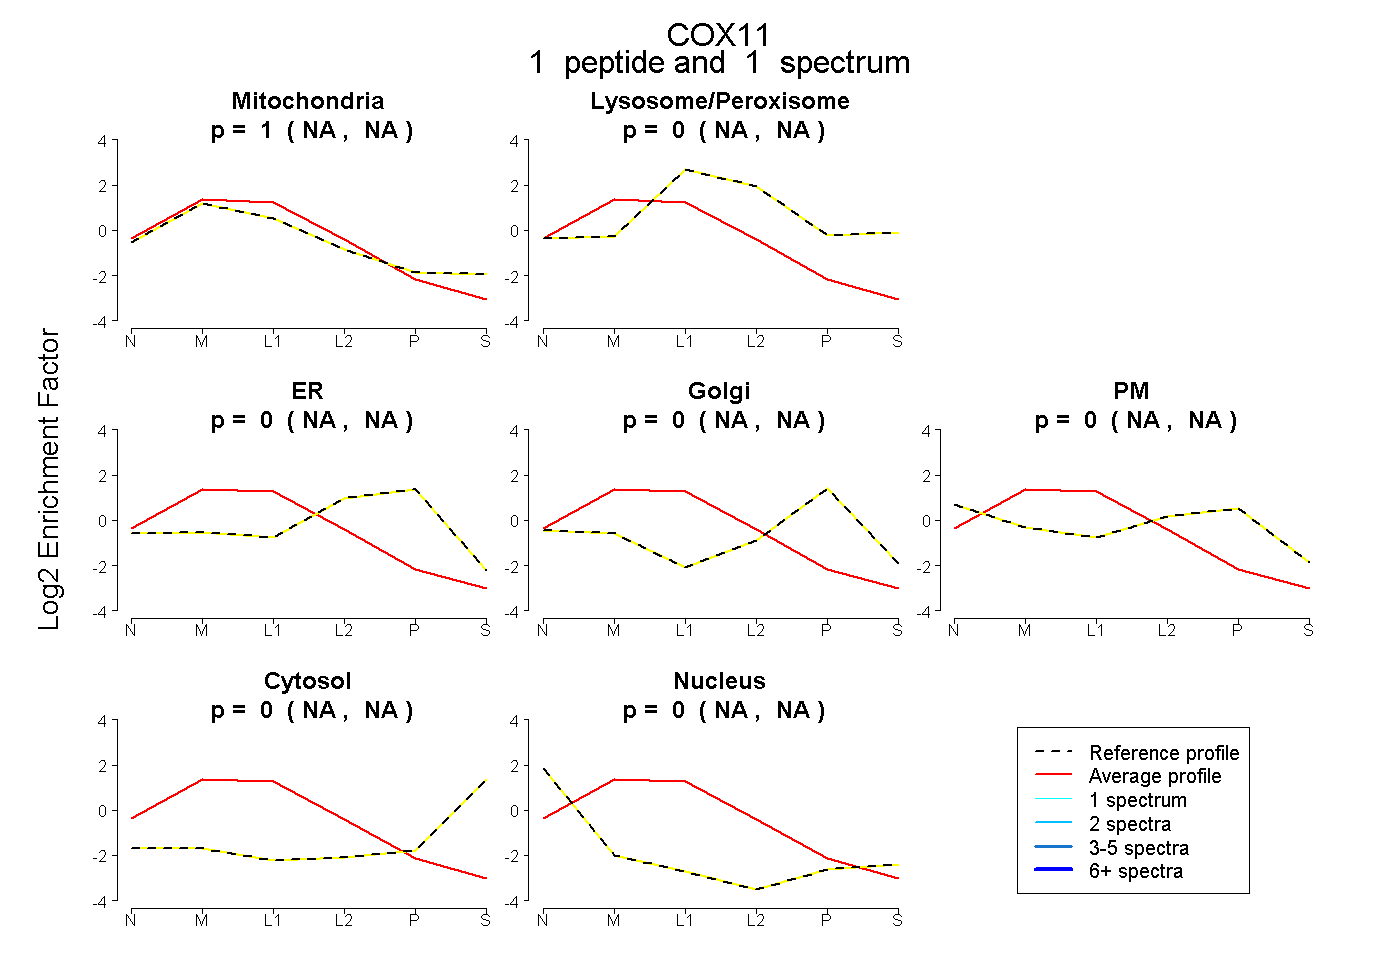
NA | NA
NA | NA
NA | NA
NA | NA
NA | NA
NA | NA
NA | NA
3peptides
spectra
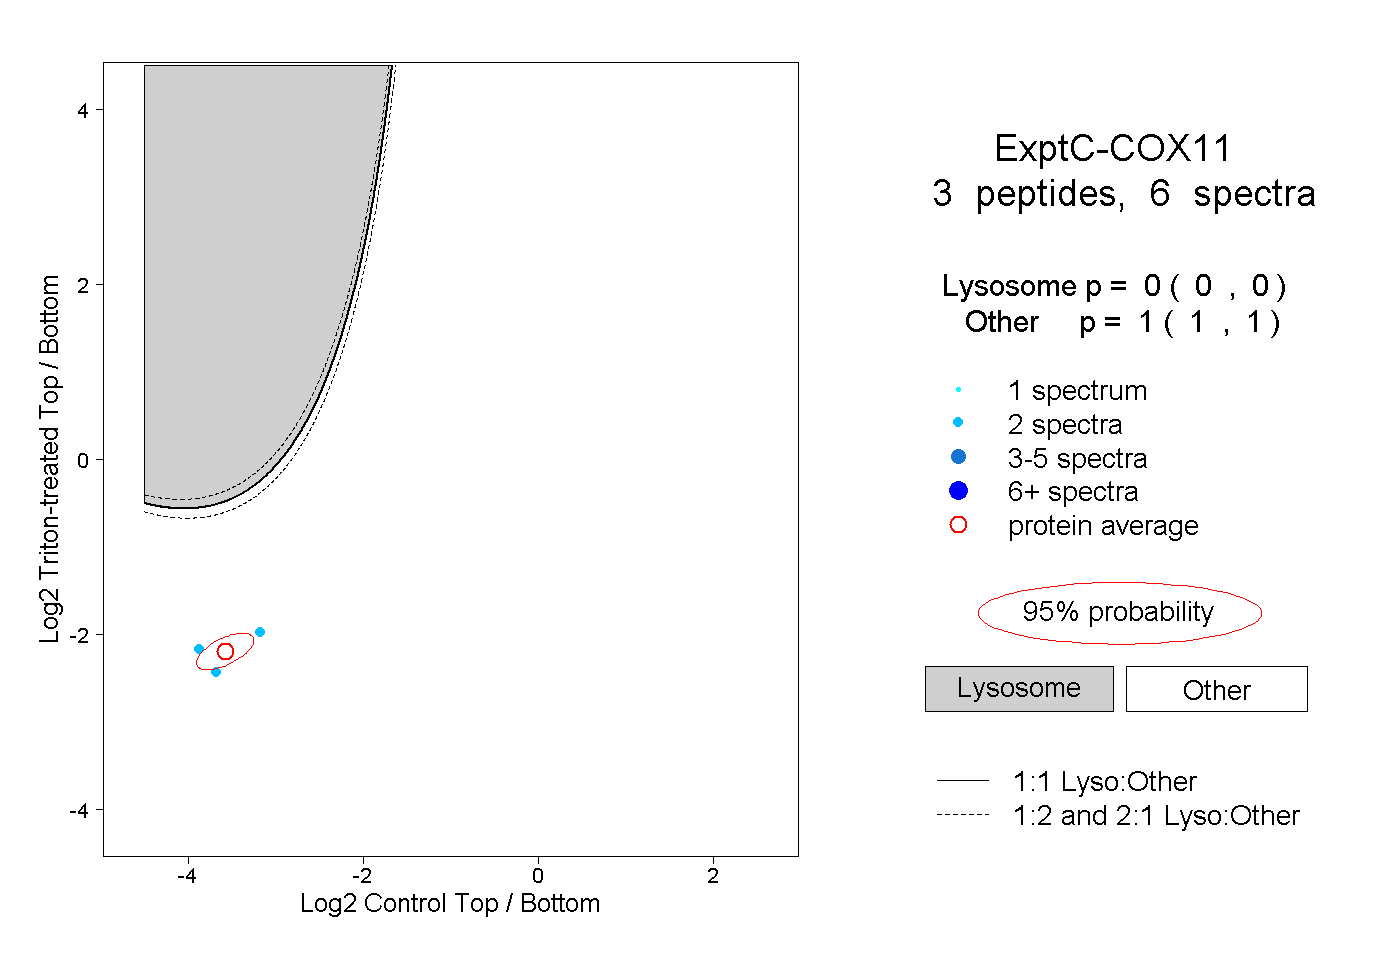
0.000 | 0.000
1.000 | 1.000
1peptide
spectrum
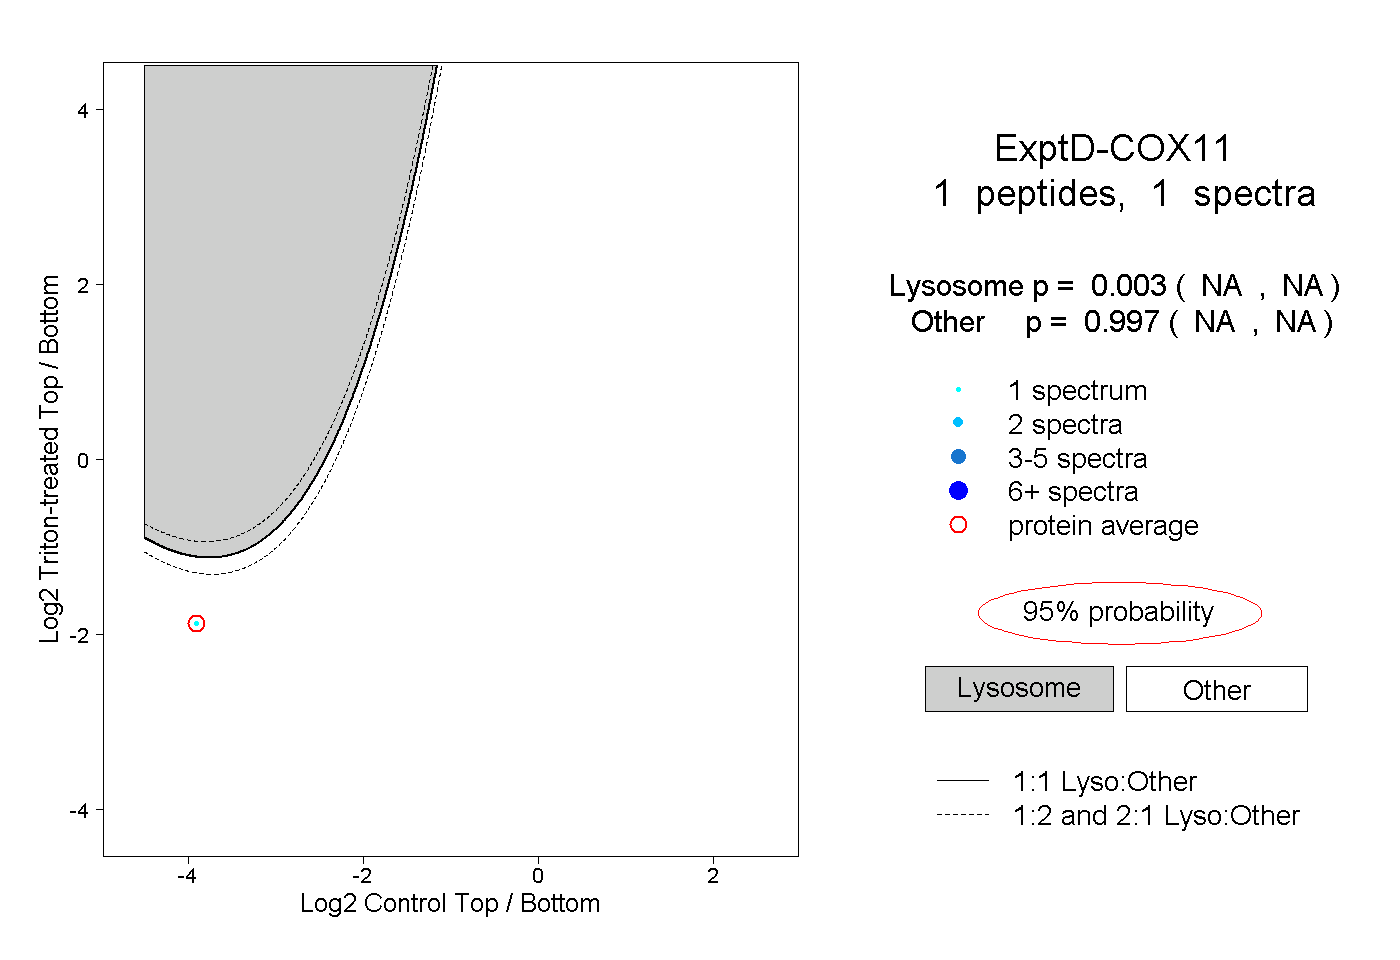
NA | NA
NA | NA