 2
2peptides
spectra
0.000 | 0.000
0.000 | 0.000
0.000 | 0.000
0.000 | 0.089
0.133 | 0.266
0.000 | 0.000
0.008 | 0.048
0.695 | 0.744
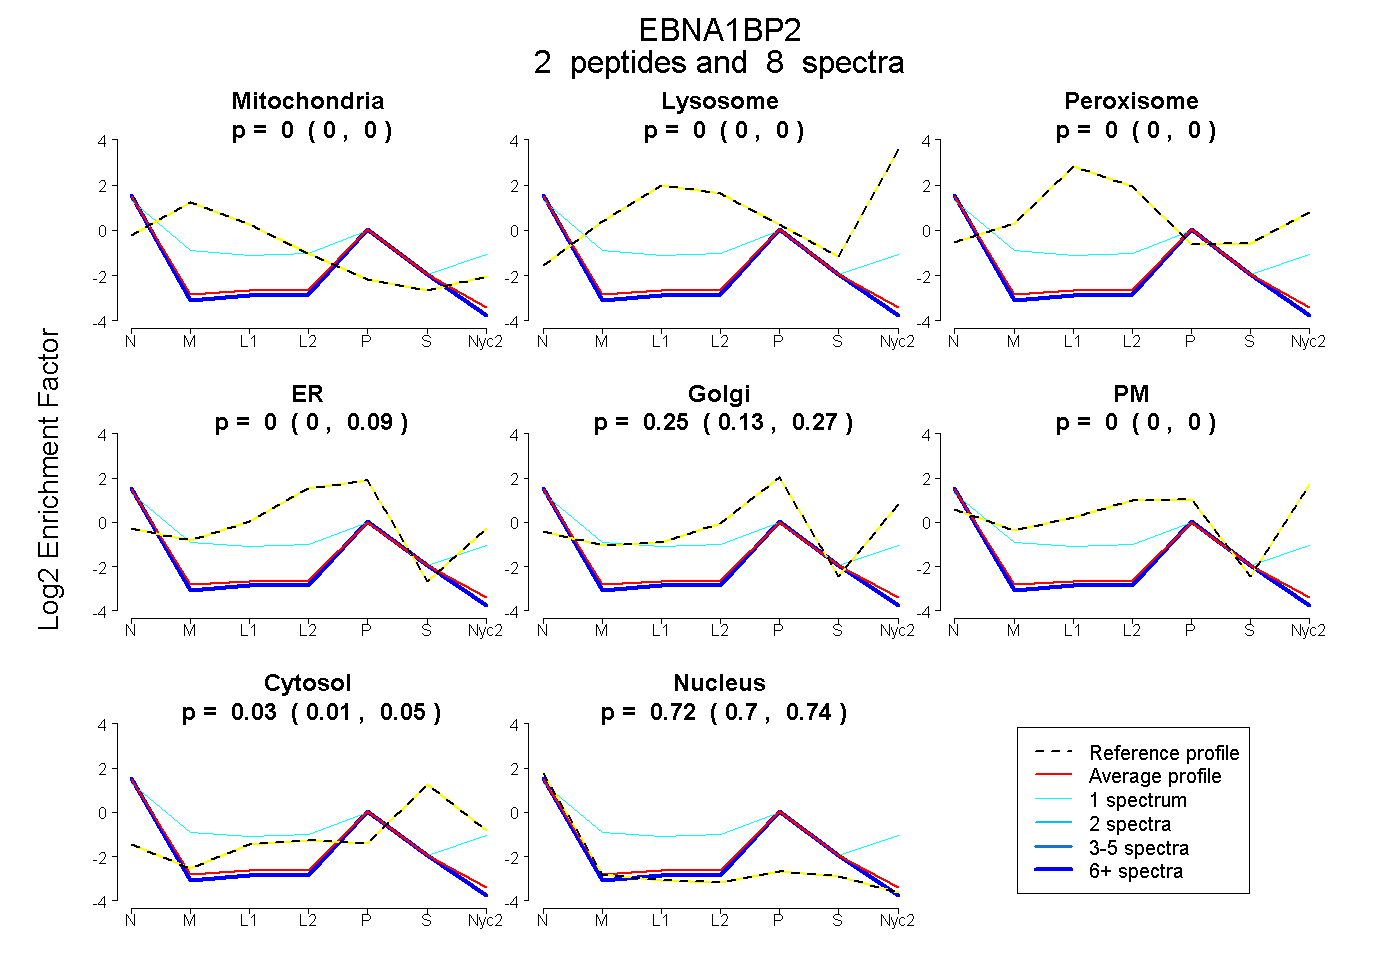
| Plot | Mito | Lyso | Perox | ER | Golgi | PM | Cytosol | Nucleus | |||||
| Expt A |
2 peptides |
8 spectra |
|
0.000 0.000 | 0.000 |
0.000 0.000 | 0.000 |
0.000 0.000 | 0.000 |
0.001 0.000 | 0.089 |
0.249 0.133 | 0.266 |
0.000 0.000 | 0.000 |
0.028 0.008 | 0.048 |
0.722 0.695 | 0.744 |