 14
14peptides
spectra
0.000 | 0.000
0.618 | 0.650
0.000 | 0.000
0.125 | 0.195
0.000 | 0.054
0.142 | 0.205
0.000 | 0.000
0.000 | 0.000
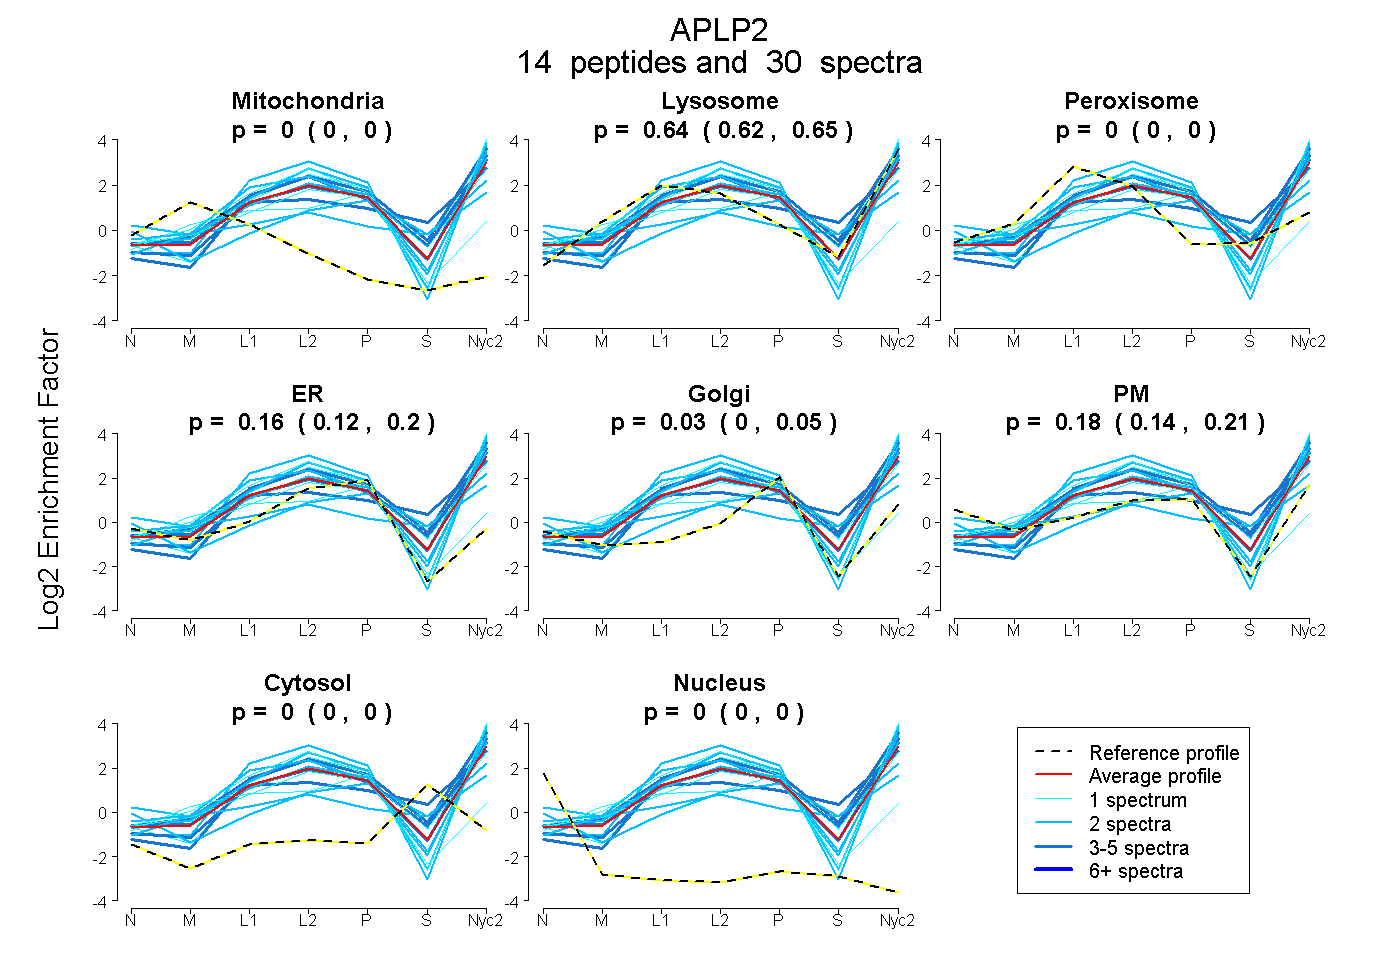
| Plot | Mito | Lyso | Perox | ER | Golgi | PM | Cytosol | Nucleus | |||||
| Expt A |
14 peptides |
30 spectra |
|
0.000 0.000 | 0.000 |
0.635 0.618 | 0.650 |
0.000 0.000 | 0.000 |
0.163 0.125 | 0.195 |
0.026 0.000 | 0.054 |
0.176 0.142 | 0.205 |
0.000 0.000 | 0.000 |
0.000 0.000 | 0.000 |
| 2 spectra, QQLVETHLAR | 0.000 | 0.365 | 0.019 | 0.000 | 0.000 | 0.388 | 0.228 | 0.000 | ||
| 1 spectrum, SQVMTHLHVIEER | 0.097 | 0.249 | 0.000 | 0.632 | 0.022 | 0.000 | 0.000 | 0.000 | ||
| 1 spectrum, EIAHDVK | 0.000 | 0.734 | 0.000 | 0.147 | 0.060 | 0.060 | 0.000 | 0.000 | ||
| 1 spectrum, VEAMLNDR | 0.000 | 0.698 | 0.000 | 0.000 | 0.000 | 0.302 | 0.000 | 0.000 | ||
| 2 spectra, VGGLEEEPDSVGPLR | 0.000 | 0.548 | 0.000 | 0.055 | 0.000 | 0.397 | 0.000 | 0.000 | ||
| 4 spectra, EWEEAELQAK | 0.000 | 0.813 | 0.000 | 0.093 | 0.091 | 0.000 | 0.002 | 0.000 | ||
| 3 spectra, EMIFNAER | 0.000 | 0.723 | 0.000 | 0.009 | 0.044 | 0.000 | 0.224 | 0.000 | ||
| 1 spectrum, QYGTISHGIVEVDPMLTPEER | 0.000 | 0.612 | 0.000 | 0.131 | 0.134 | 0.112 | 0.011 | 0.000 | ||
| 2 spectra, GSGMAEQDGGLIGAEEK | 0.000 | 0.223 | 0.000 | 0.000 | 0.174 | 0.351 | 0.252 | 0.000 | ||
| 3 spectra, QTLIQHFQAMVK | 0.000 | 0.693 | 0.000 | 0.056 | 0.091 | 0.160 | 0.000 | 0.000 | ||
| 4 spectra, FIYGGCGGNR | 0.000 | 0.727 | 0.000 | 0.104 | 0.000 | 0.168 | 0.000 | 0.000 | ||
| 2 spectra, AVCSQEAMTGPCR | 0.000 | 0.756 | 0.000 | 0.244 | 0.000 | 0.000 | 0.000 | 0.000 | ||
| 2 spectra, ILQALR | 0.000 | 0.647 | 0.000 | 0.085 | 0.000 | 0.268 | 0.000 | 0.000 | ||
| 2 spectra, SHIVIPFK | 0.000 | 0.807 | 0.000 | 0.161 | 0.000 | 0.032 | 0.000 | 0.000 |
| Plot | Mito | Lyso or Perox | ER | Golgi | PM | Cytosol | Nucleus | ||||||
| Expt B |
2 peptides |
5 spectra |
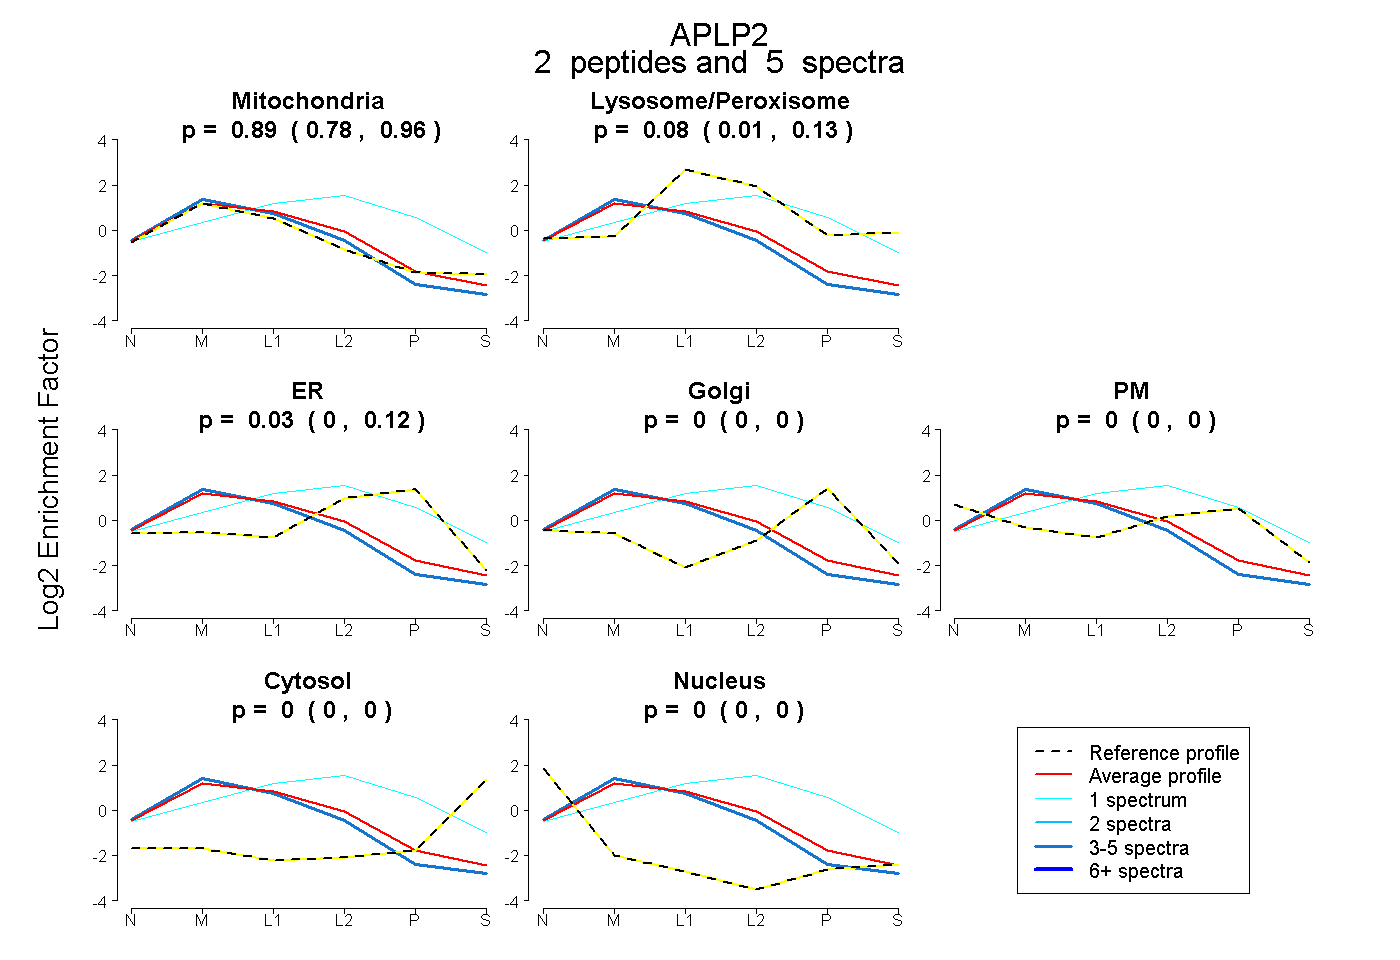 |
0.886 0.778 | 0.959 |
0.080 0.009 | 0.126 |
0.035 0.000 | 0.117 |
0.000 0.000 | 0.000 |
0.000 0.000 | 0.000 |
0.000 0.000 | 0.000 |
0.000 0.000 | 0.000 |
|||
| Plot | Lyso | Other | |||||||||||
| Expt C |
18 peptides |
104 spectra |
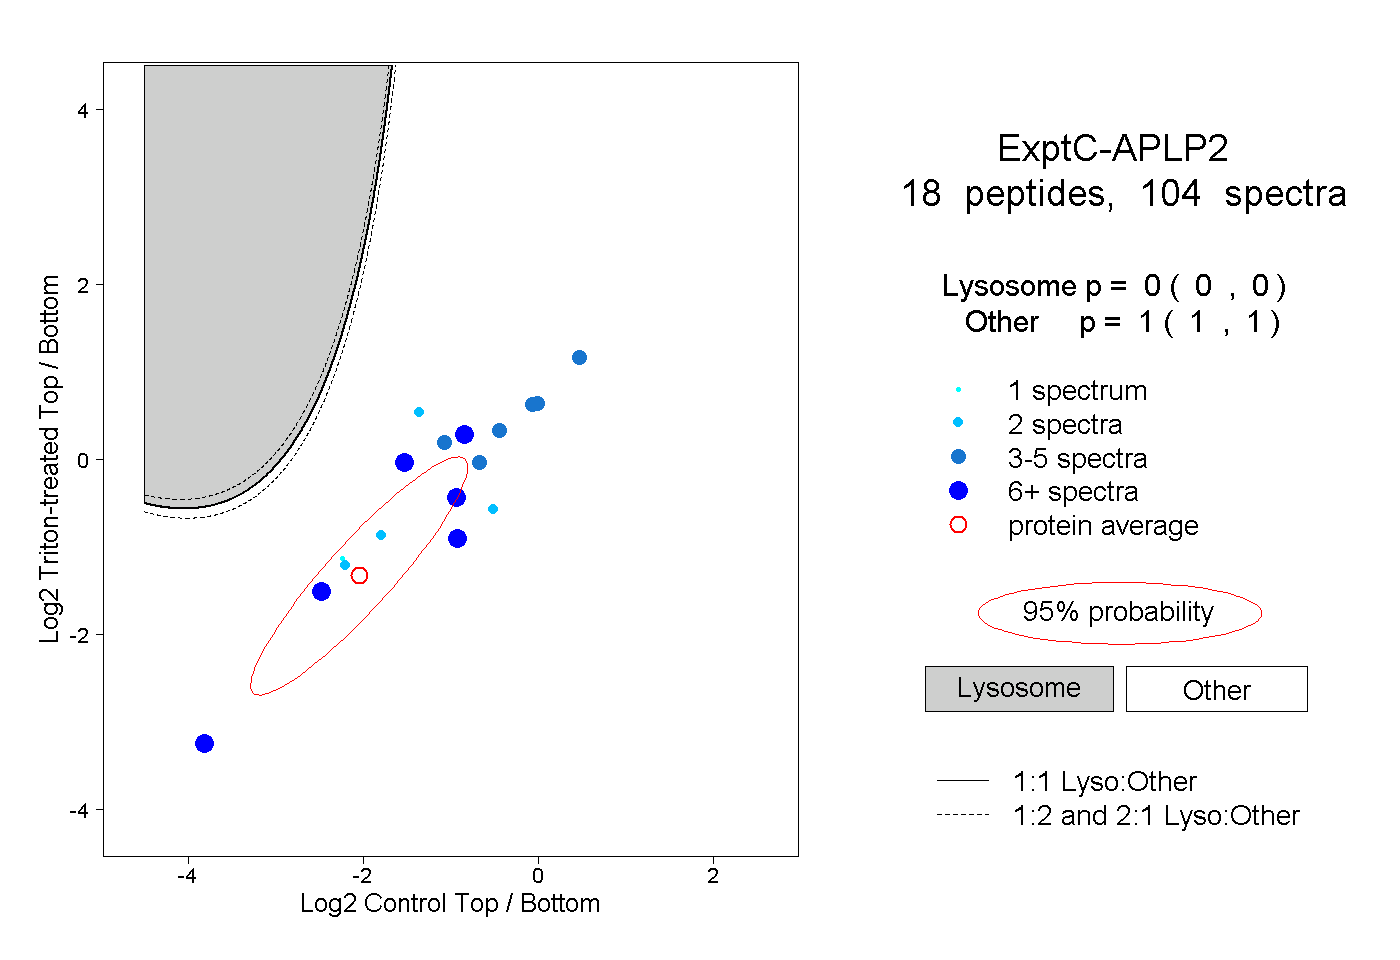 |
0.000 0.000 | 0.000 |
1.000 1.000 | 1.000 |
||||||||
| Plot | Lyso | Other | |||||||||||
| Expt D |
2 peptides |
3 spectra |
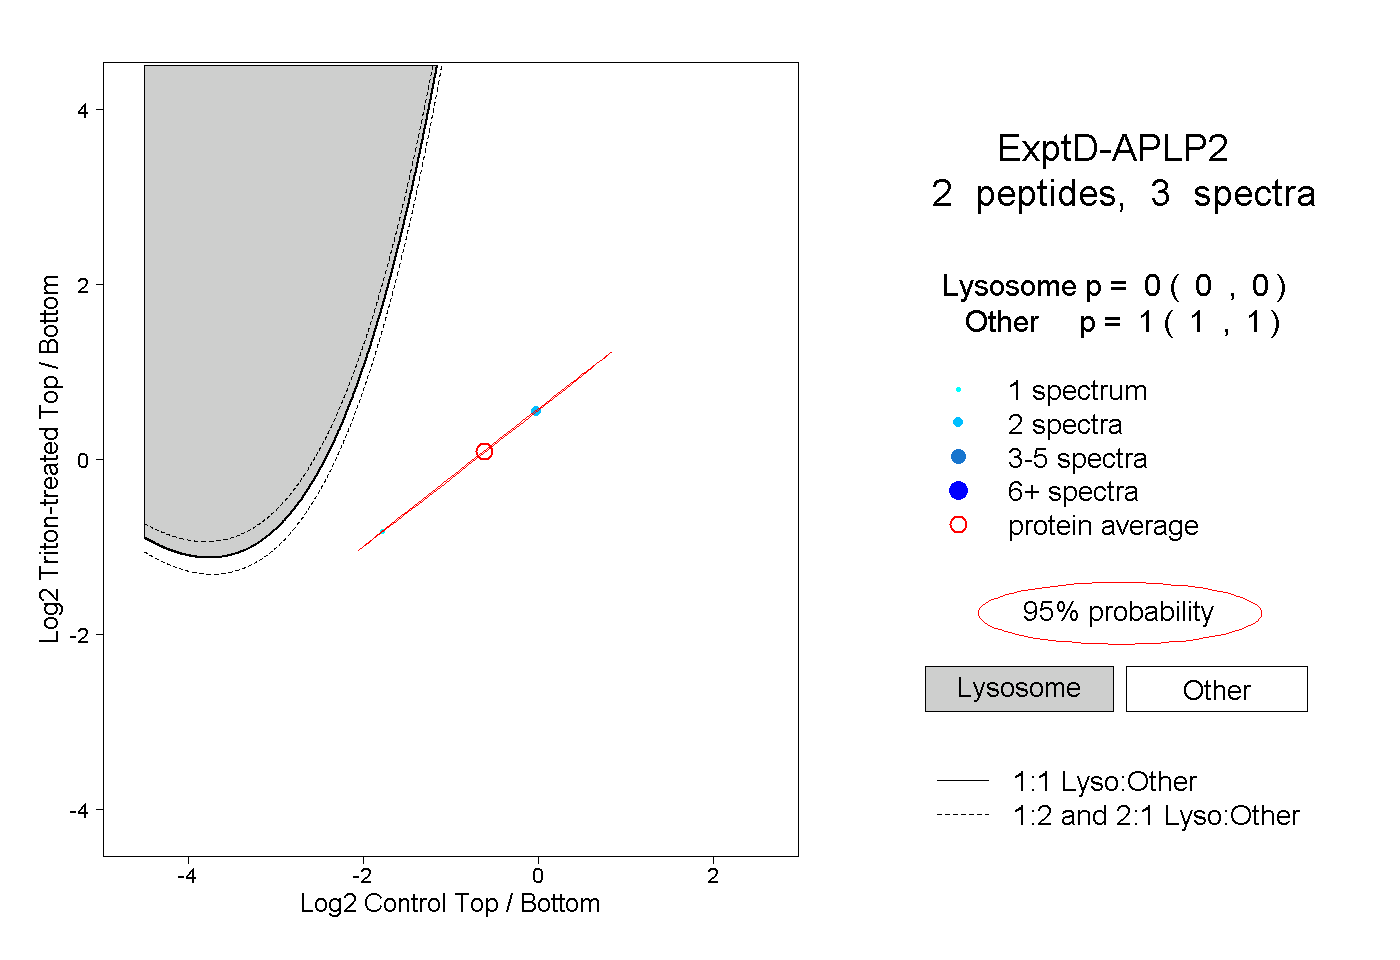 |
0.000 0.000 | 0.000 |
1.000 1.000 | 1.000 |