 14
14peptides
spectra
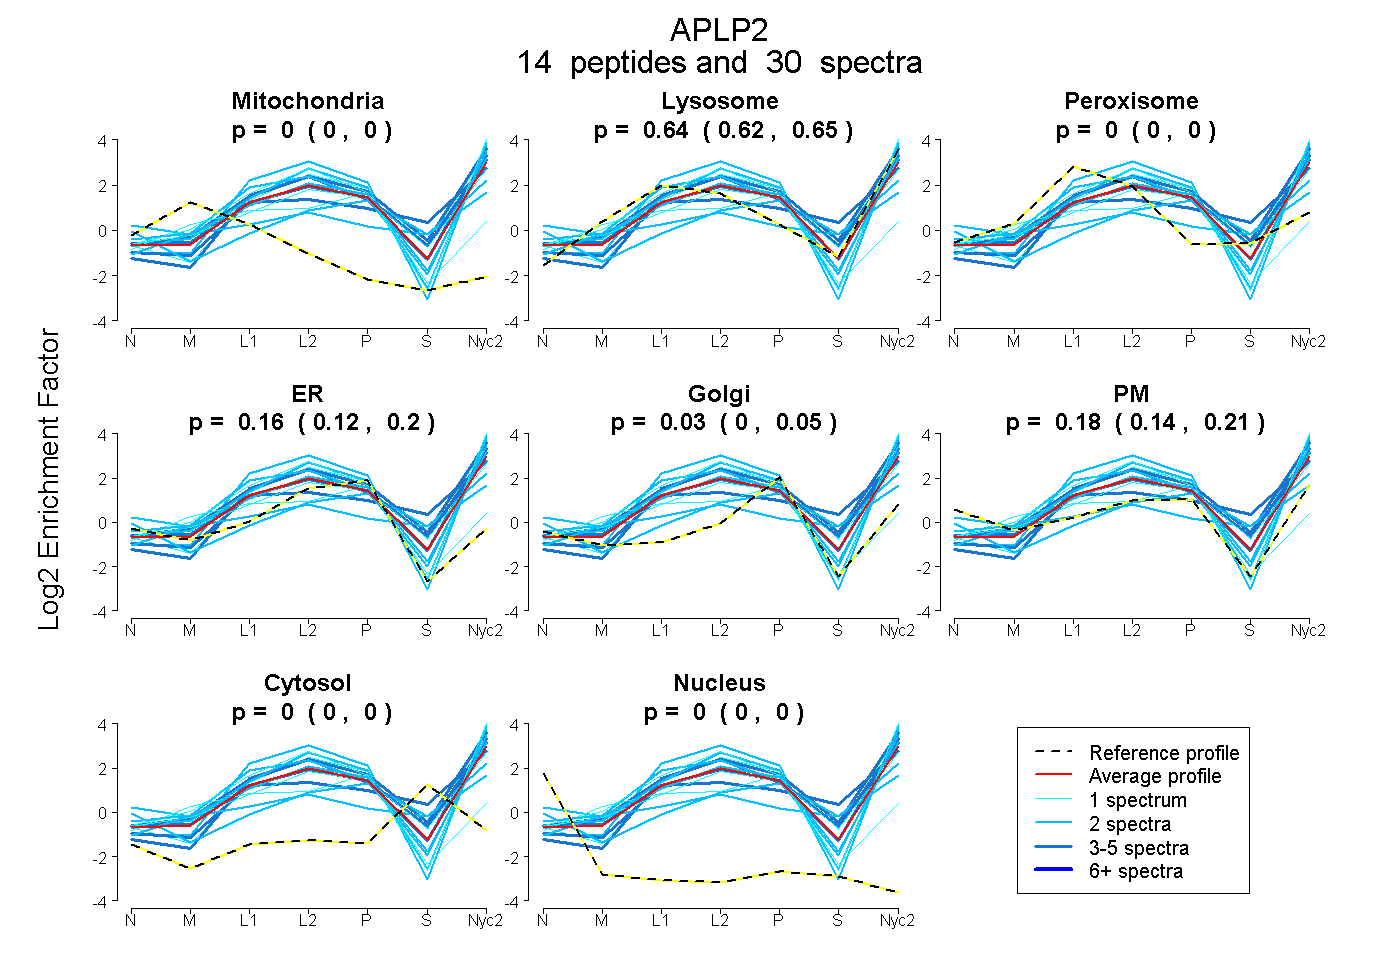
0.000 | 0.000
0.618 | 0.650
0.000 | 0.000
0.125 | 0.195
0.000 | 0.054
0.142 | 0.205
0.000 | 0.000
0.000 | 0.000
2peptides
spectra
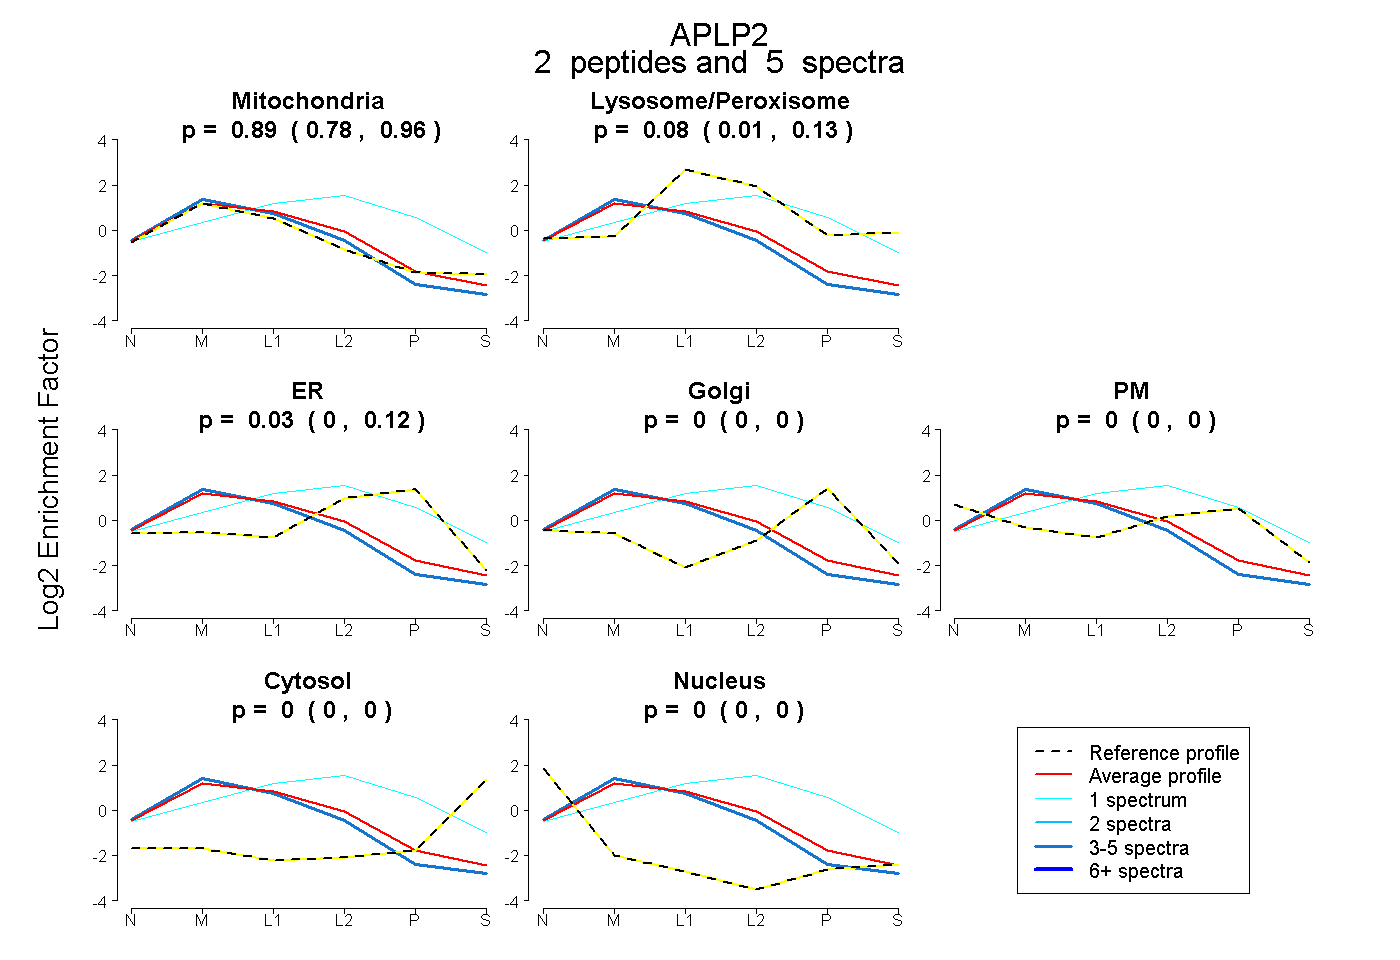
0.778 | 0.959
0.009 | 0.126
0.000 | 0.117
0.000 | 0.000
0.000 | 0.000
0.000 | 0.000
0.000 | 0.000
18peptides
spectra
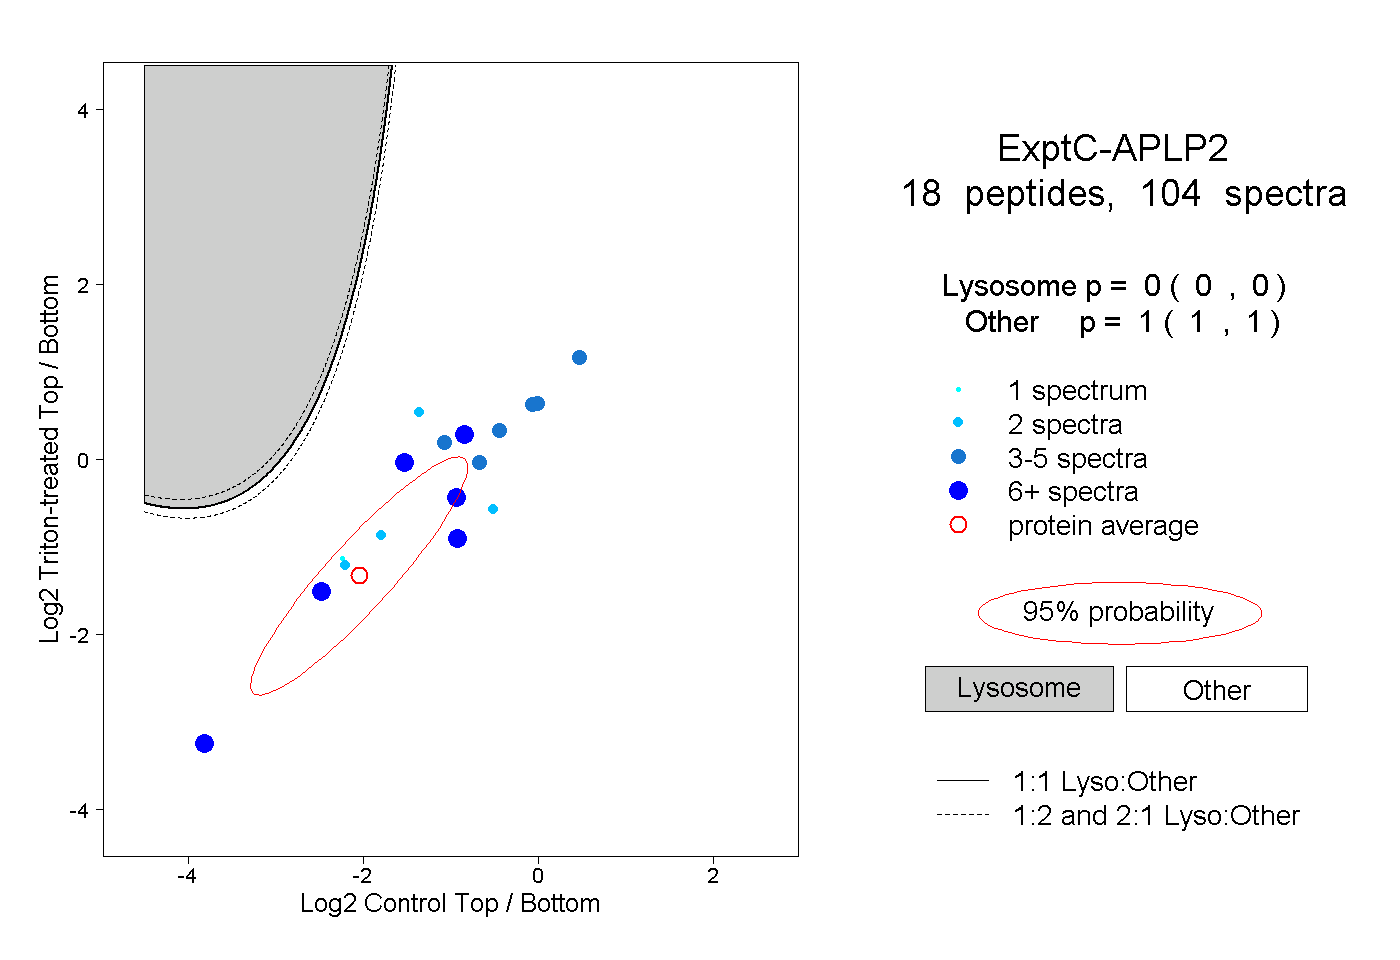
0.000 | 0.000
1.000 | 1.000
2peptides
spectra
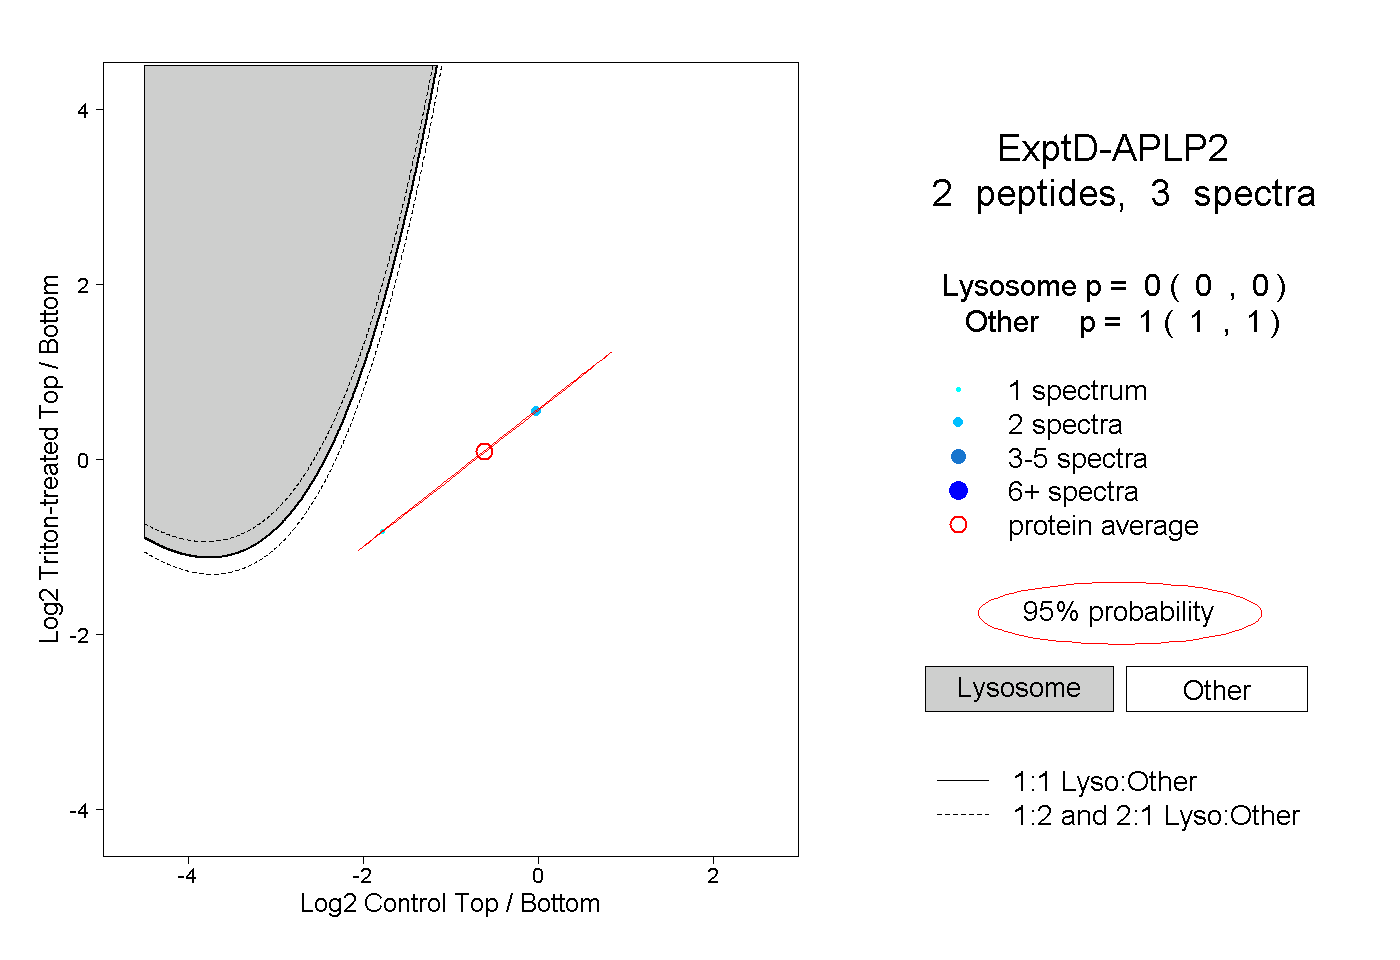
0.000 | 0.000
1.000 | 1.000