 3
3peptides
spectra
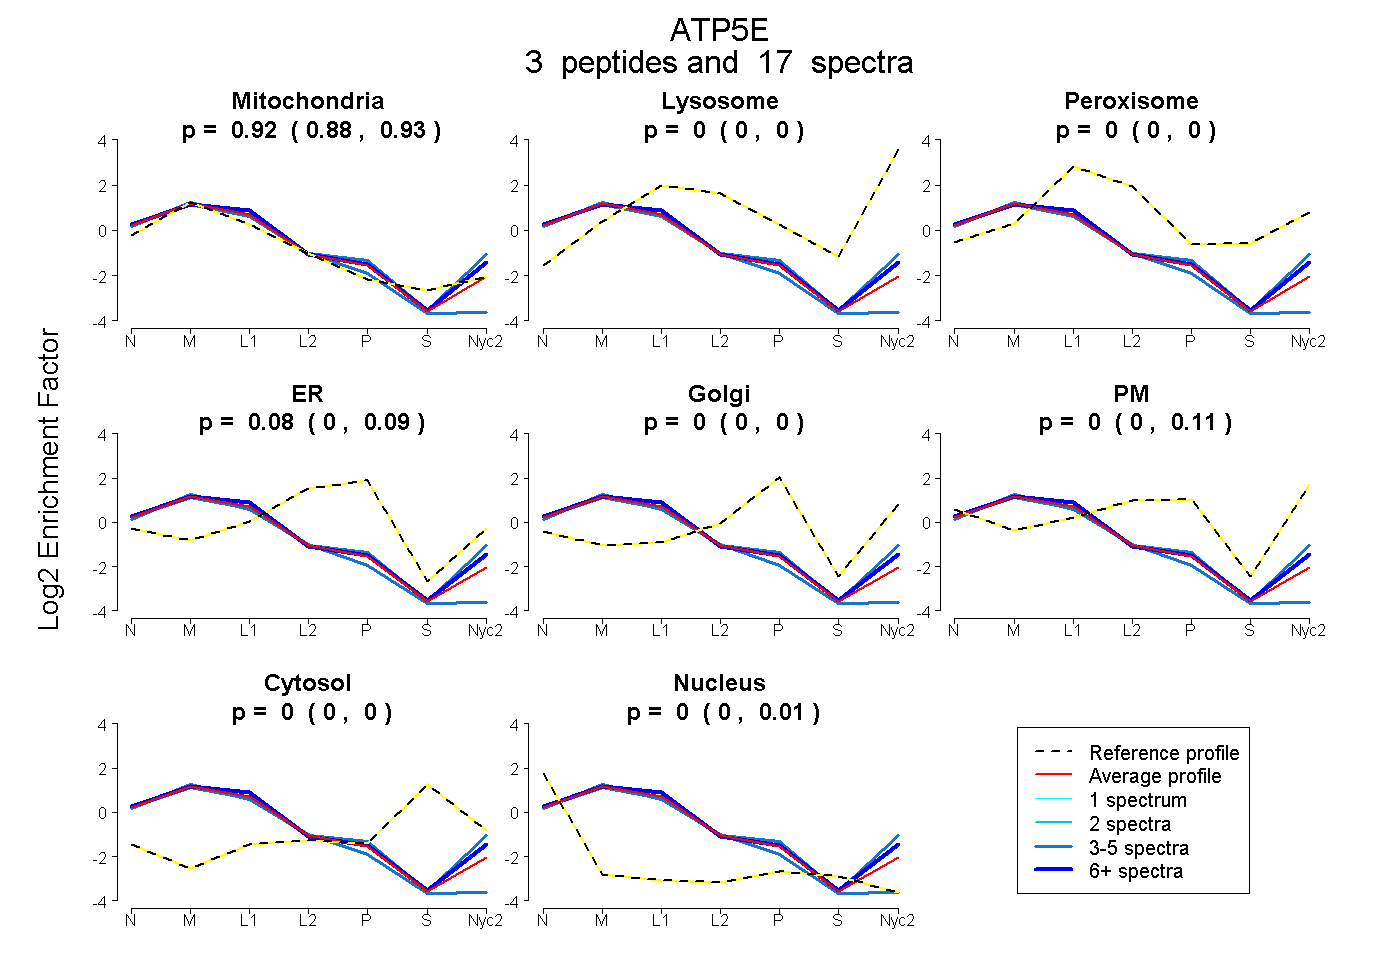
0.881 | 0.930
0.000 | 0.000
0.000 | 0.000
0.000 | 0.086
0.000 | 0.000
0.000 | 0.110
0.000 | 0.000
0.000 | 0.009
4peptides
spectra
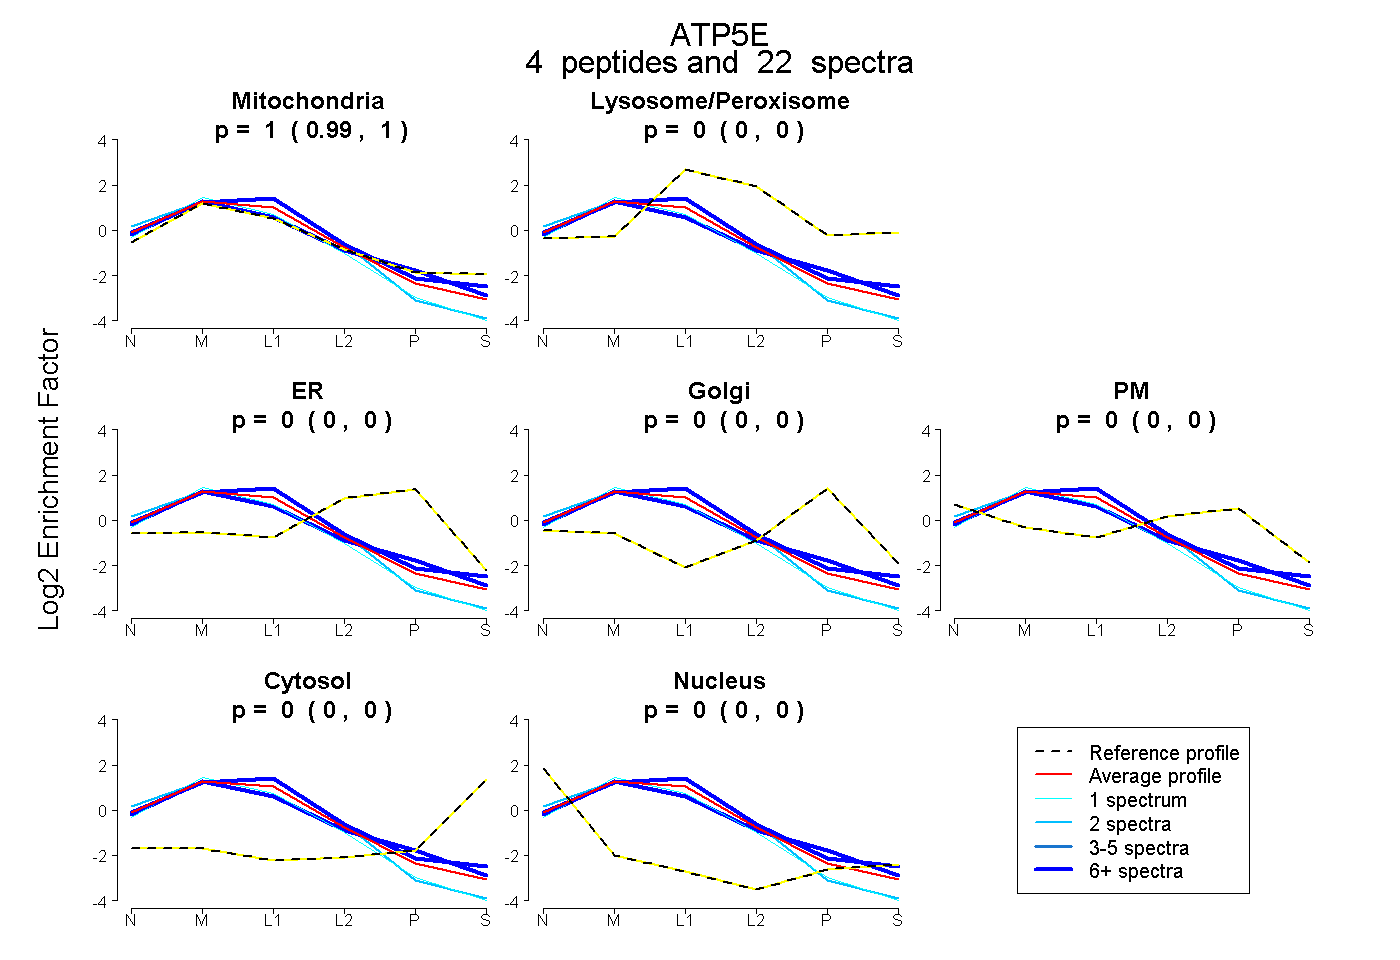
0.994 | 1.000
0.000 | 0.000
0.000 | 0.000
0.000 | 0.000
0.000 | 0.000
0.000 | 0.000
0.000 | 0.004
4peptides
spectra
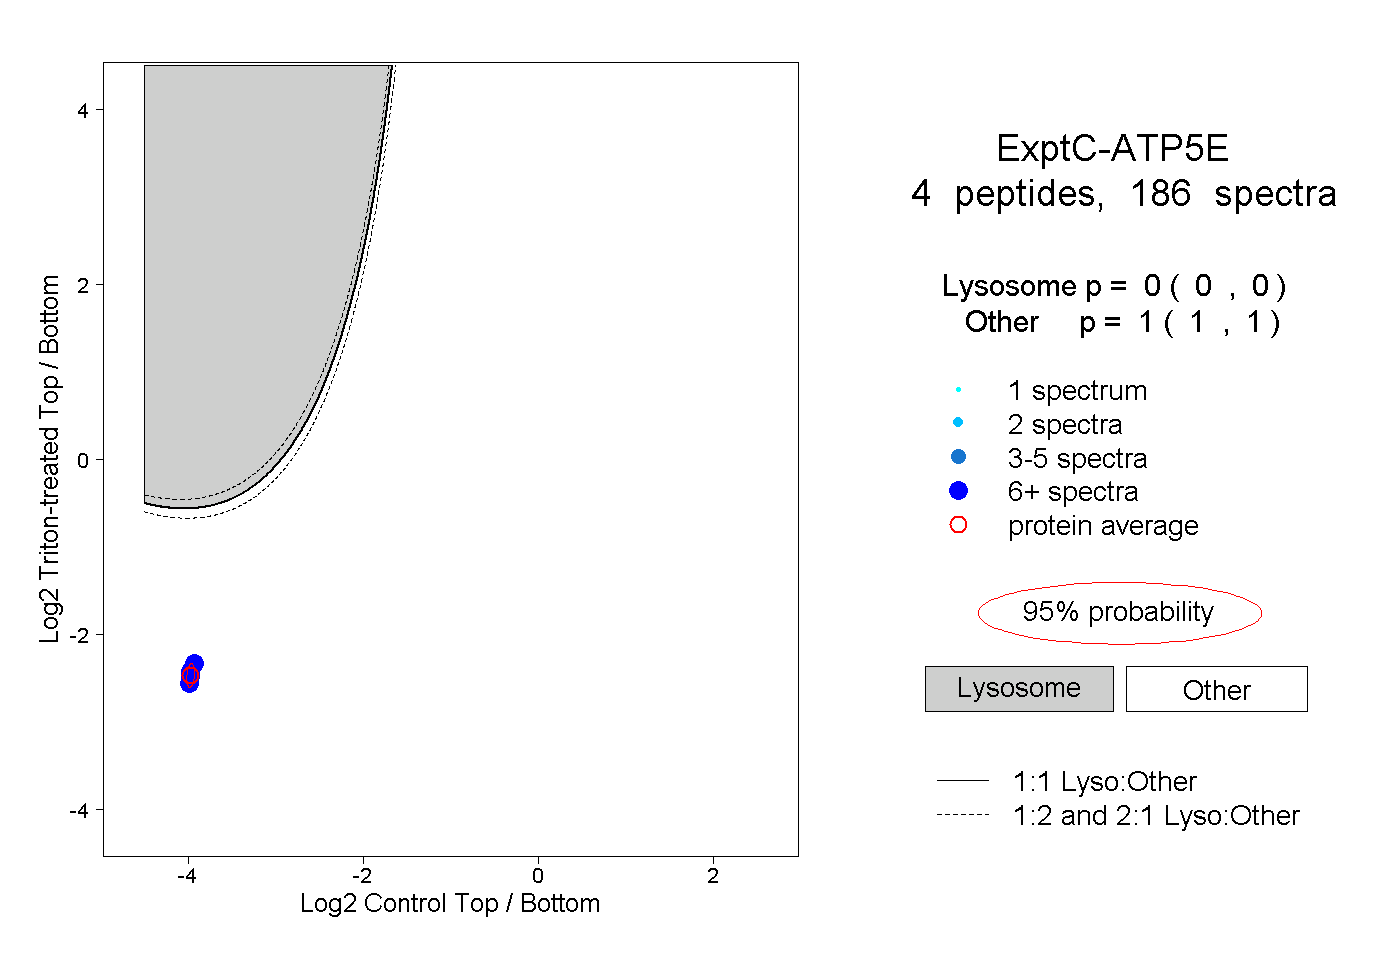
0.000 | 0.000
1.000 | 1.000
3peptides
spectra
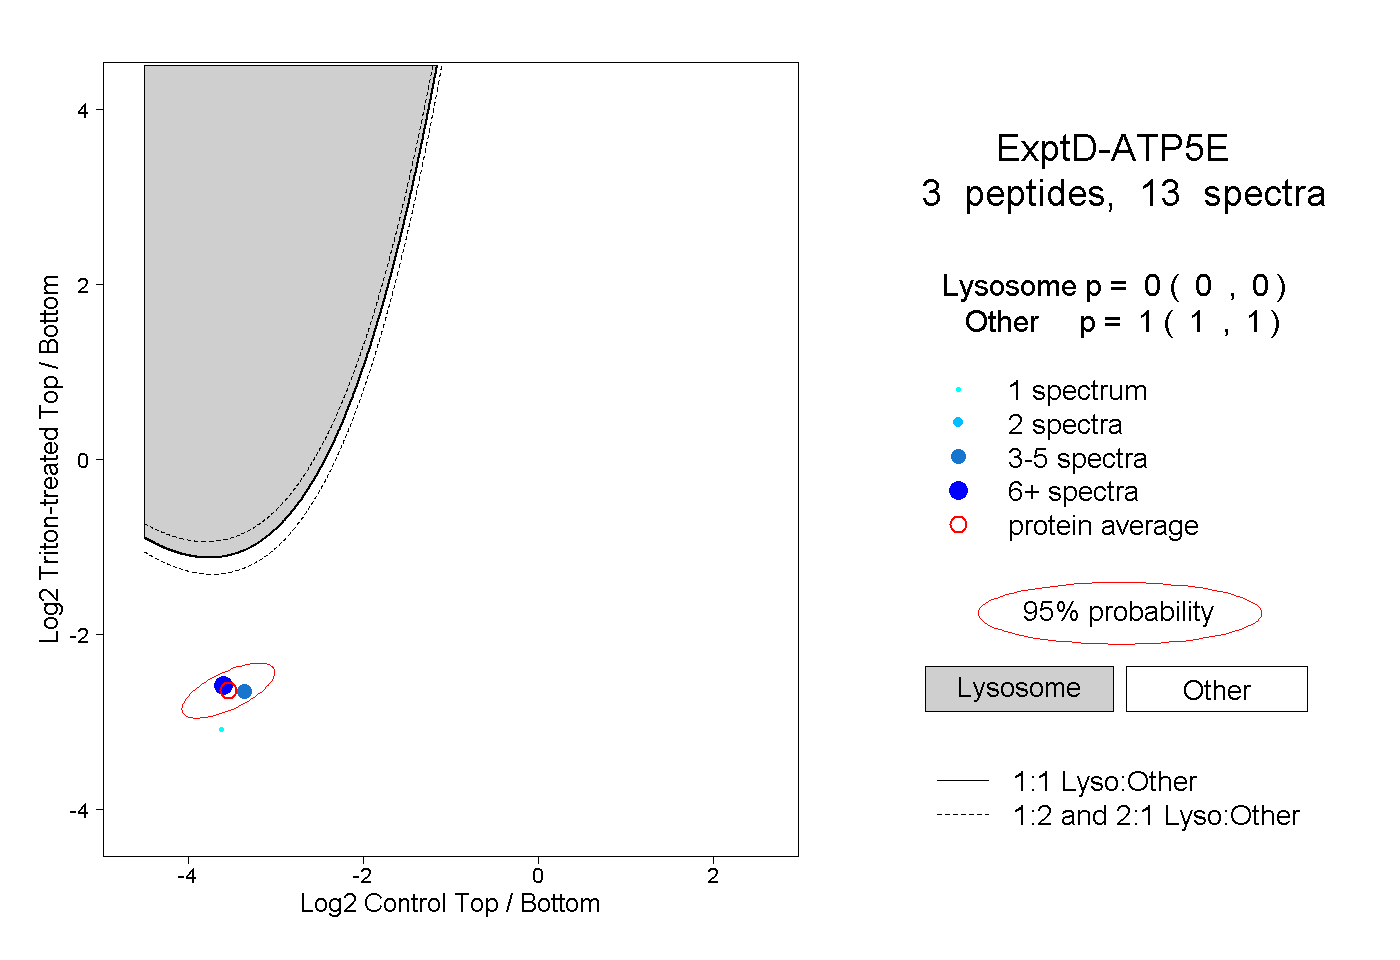
0.000 | 0.000
1.000 | 1.000