 6
6peptides
spectra
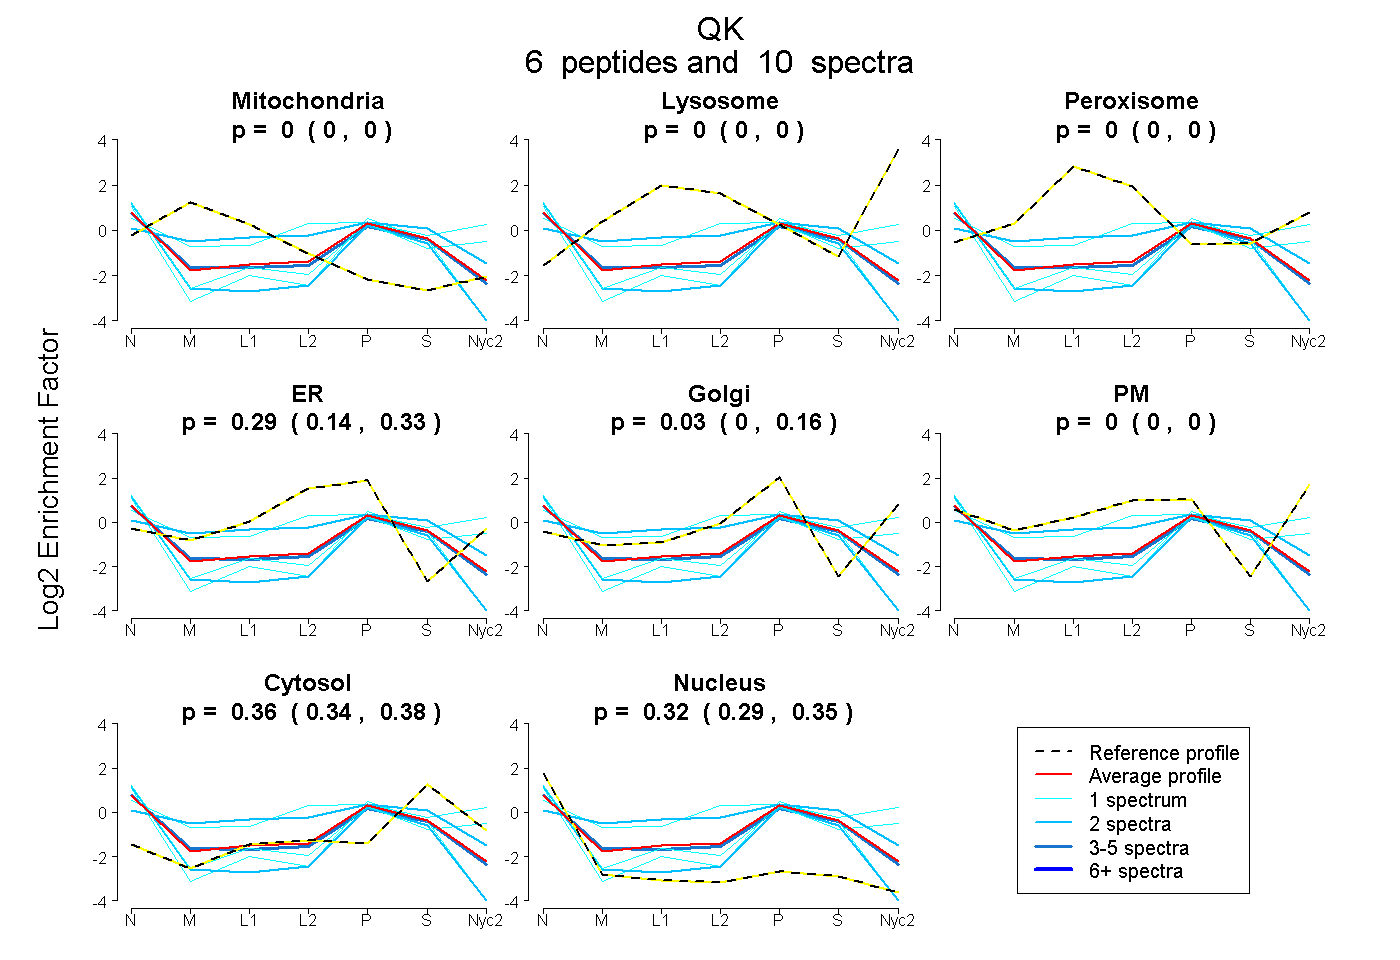
0.000 | 0.000
0.000 | 0.000
0.000 | 0.000
0.143 | 0.332
0.000 | 0.162
0.000 | 0.000
0.341 | 0.379
0.287 | 0.349
| Plot | Mito | Lyso | Perox | ER | Golgi | PM | Cytosol | Nucleus | |||||
| Expt A |
6 peptides |
10 spectra |
|
0.000 0.000 | 0.000 |
0.000 0.000 | 0.000 |
0.000 0.000 | 0.000 |
0.286 0.143 | 0.332 |
0.029 0.000 | 0.162 |
0.000 0.000 | 0.000 |
0.365 0.341 | 0.379 |
0.320 0.287 | 0.349 |
| 1 spectrum, DMYNDTLNGSTEK | 0.000 | 0.000 | 0.039 | 0.036 | 0.000 | 0.528 | 0.387 | 0.010 | ||
| 1 spectrum, SAELPDAVGPIVQLQEK | 0.000 | 0.000 | 0.000 | 0.000 | 0.386 | 0.029 | 0.283 | 0.303 | ||
| 3 spectra, EYPDFNFVGR | 0.000 | 0.000 | 0.000 | 0.259 | 0.032 | 0.000 | 0.362 | 0.347 | ||
| 2 spectra, TPTPAGPTIMPLIR | 0.177 | 0.000 | 0.059 | 0.340 | 0.000 | 0.000 | 0.425 | 0.000 | ||
| 1 spectrum, IVTADR | 0.000 | 0.000 | 0.000 | 0.132 | 0.000 | 0.000 | 0.315 | 0.552 | ||
| 2 spectra, LYVPVK | 0.000 | 0.000 | 0.000 | 0.122 | 0.000 | 0.000 | 0.266 | 0.613 |
| Plot | Mito | Lyso or Perox | ER | Golgi | PM | Cytosol | Nucleus | ||||||
| Expt B |
1 peptide |
1 spectrum |
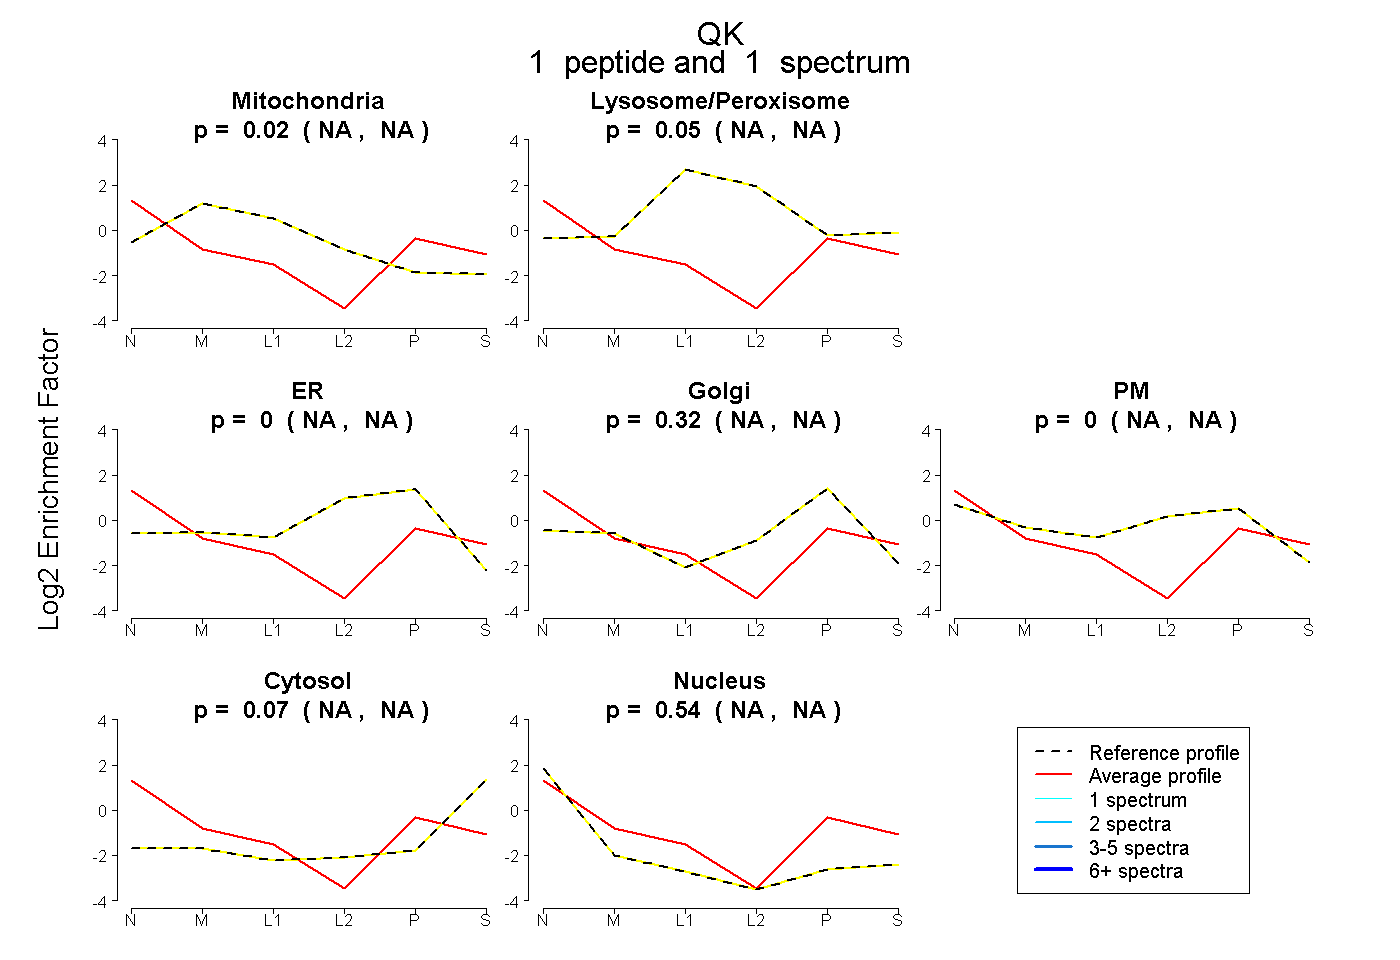 |
0.017 NA | NA |
0.048 NA | NA |
0.000 NA | NA |
0.324 NA | NA |
0.000 NA | NA |
0.073 NA | NA |
0.539 NA | NA |
|||
| Plot | Lyso | Other | |||||||||||
| Expt C |
2 peptides |
6 spectra |
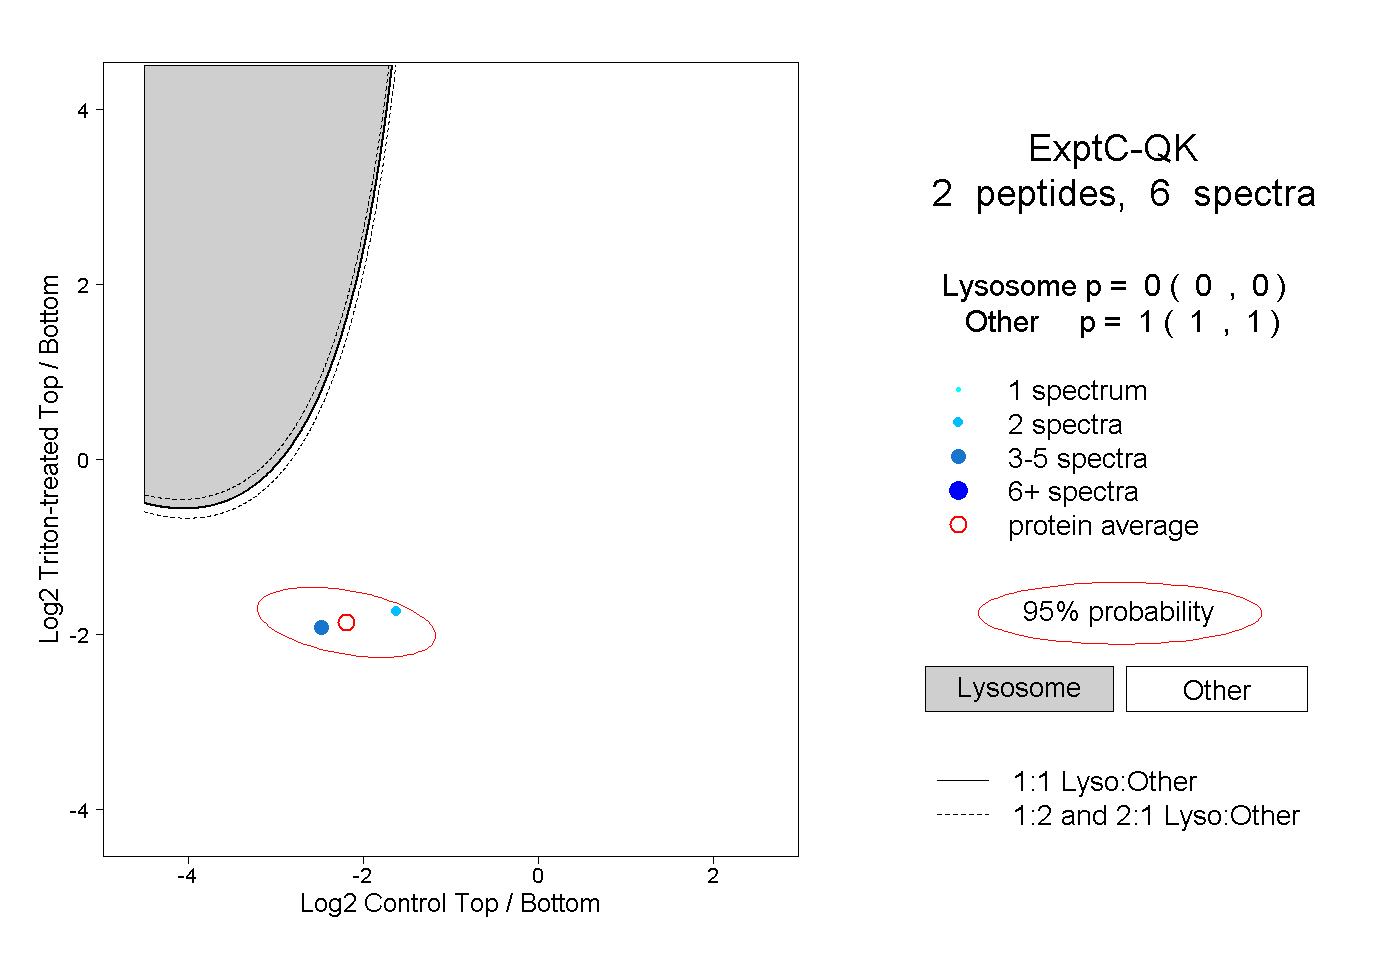 |
0.000 0.000 | 0.000 |
1.000 1.000 | 1.000 |