 2
2peptides
spectra
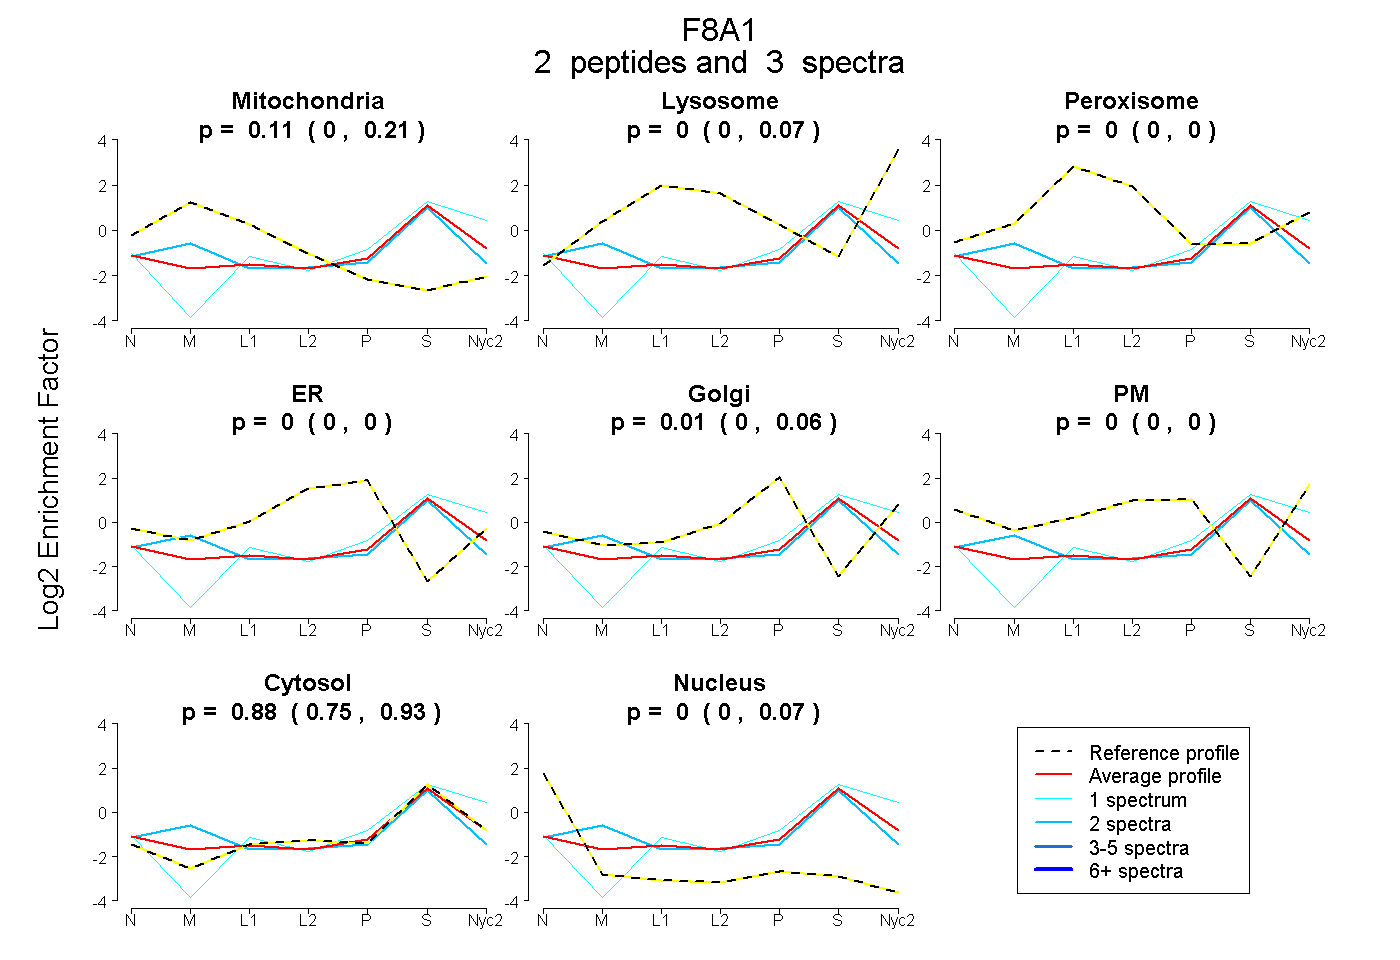
0.000 | 0.215
0.000 | 0.073
0.000 | 0.000
0.000 | 0.000
0.000 | 0.056
0.000 | 0.004
0.747 | 0.934
0.000 | 0.075
1peptide
spectra
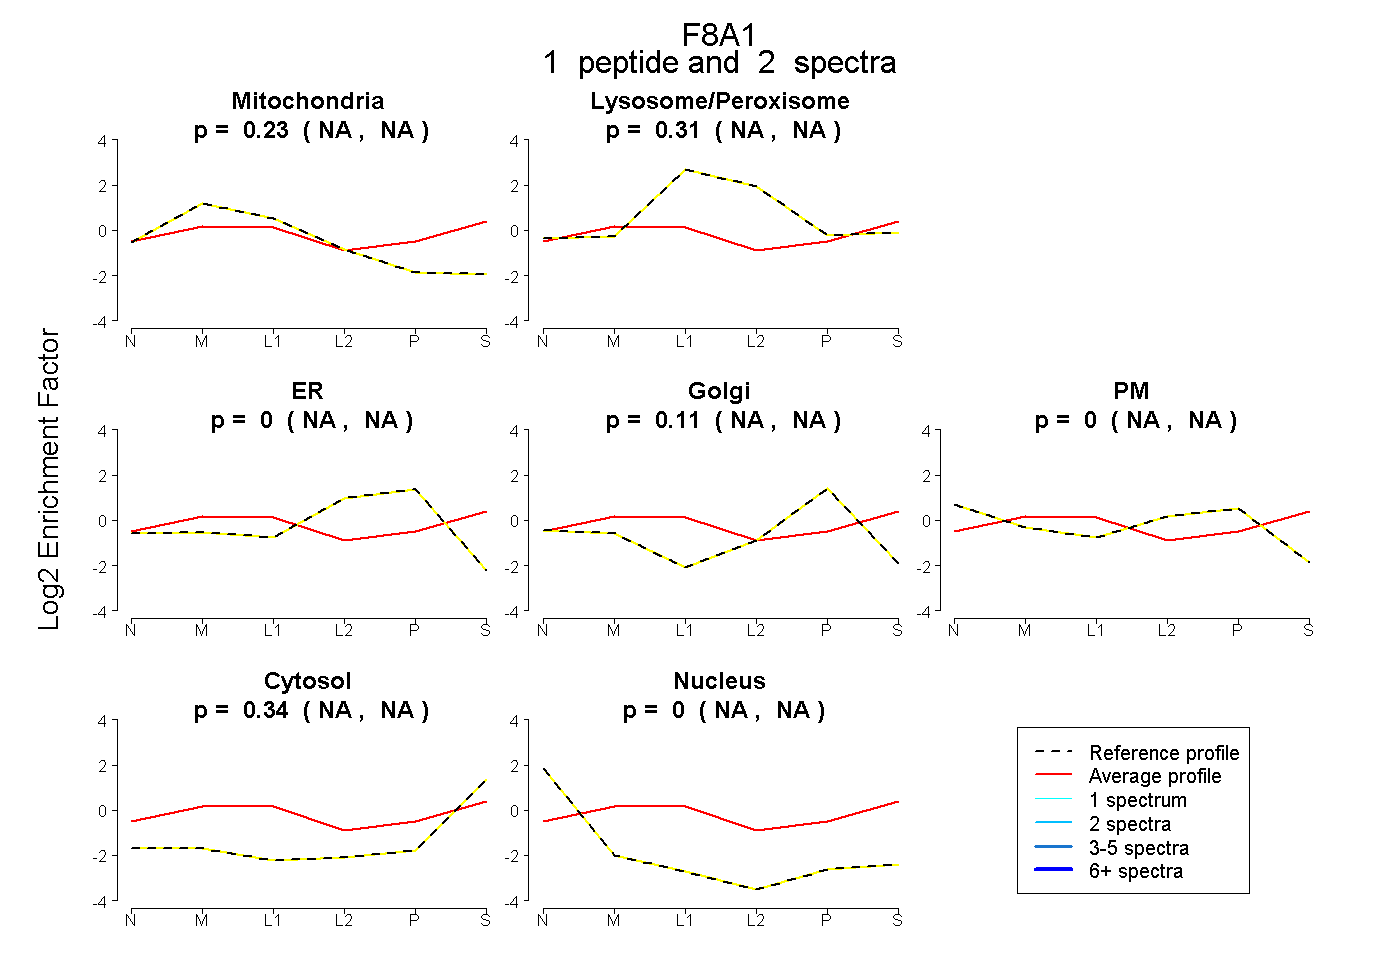
NA | NA
NA | NA
NA | NA
NA | NA
NA | NA
NA | NA
NA | NA
1peptide
spectra
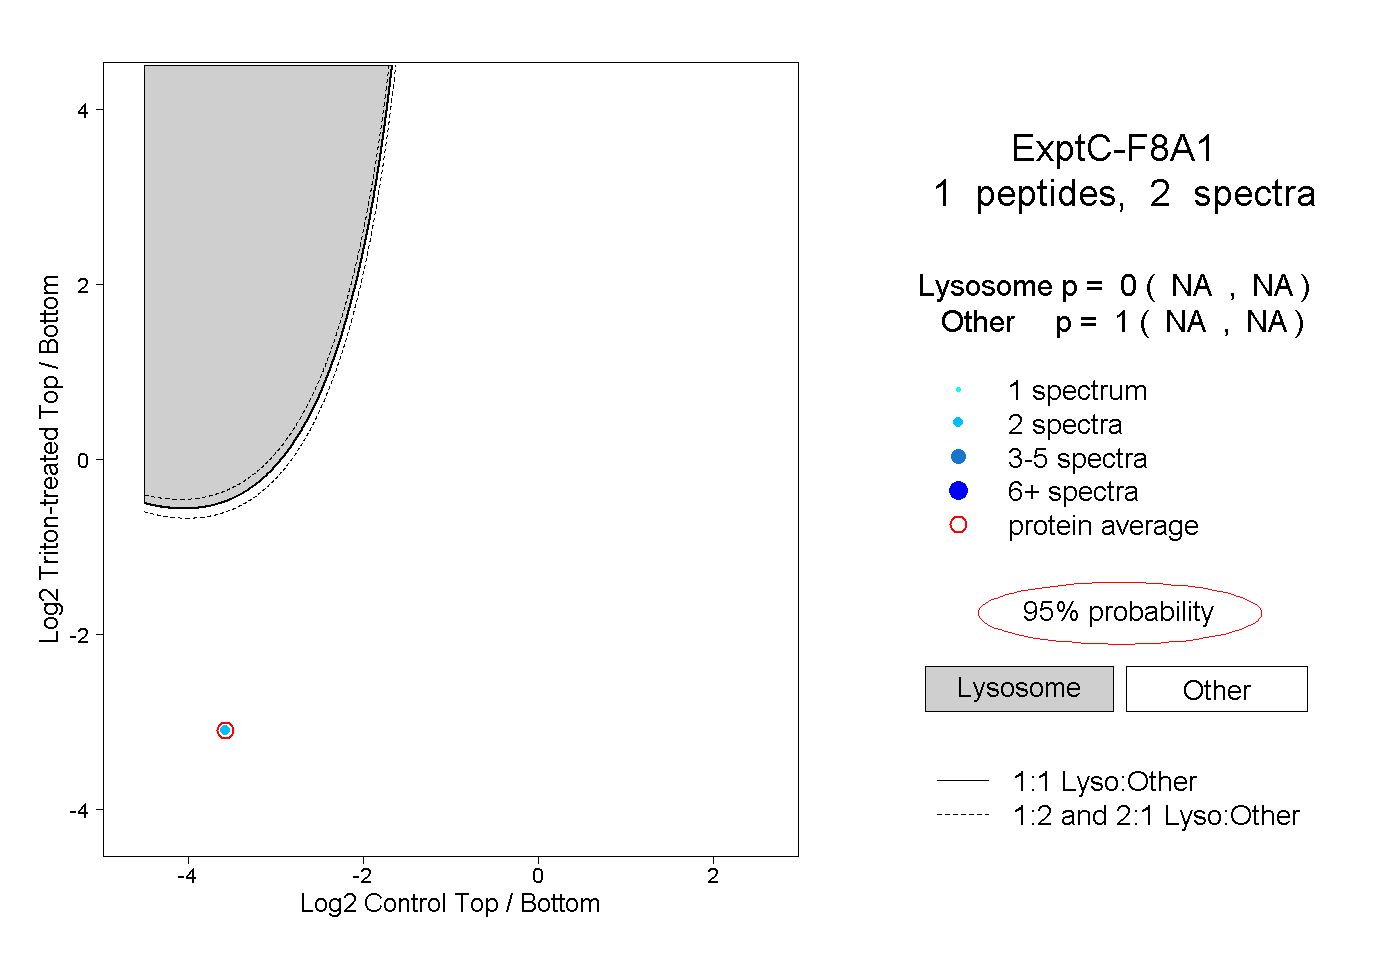
NA | NA
NA | NA