 15
15peptides
spectra
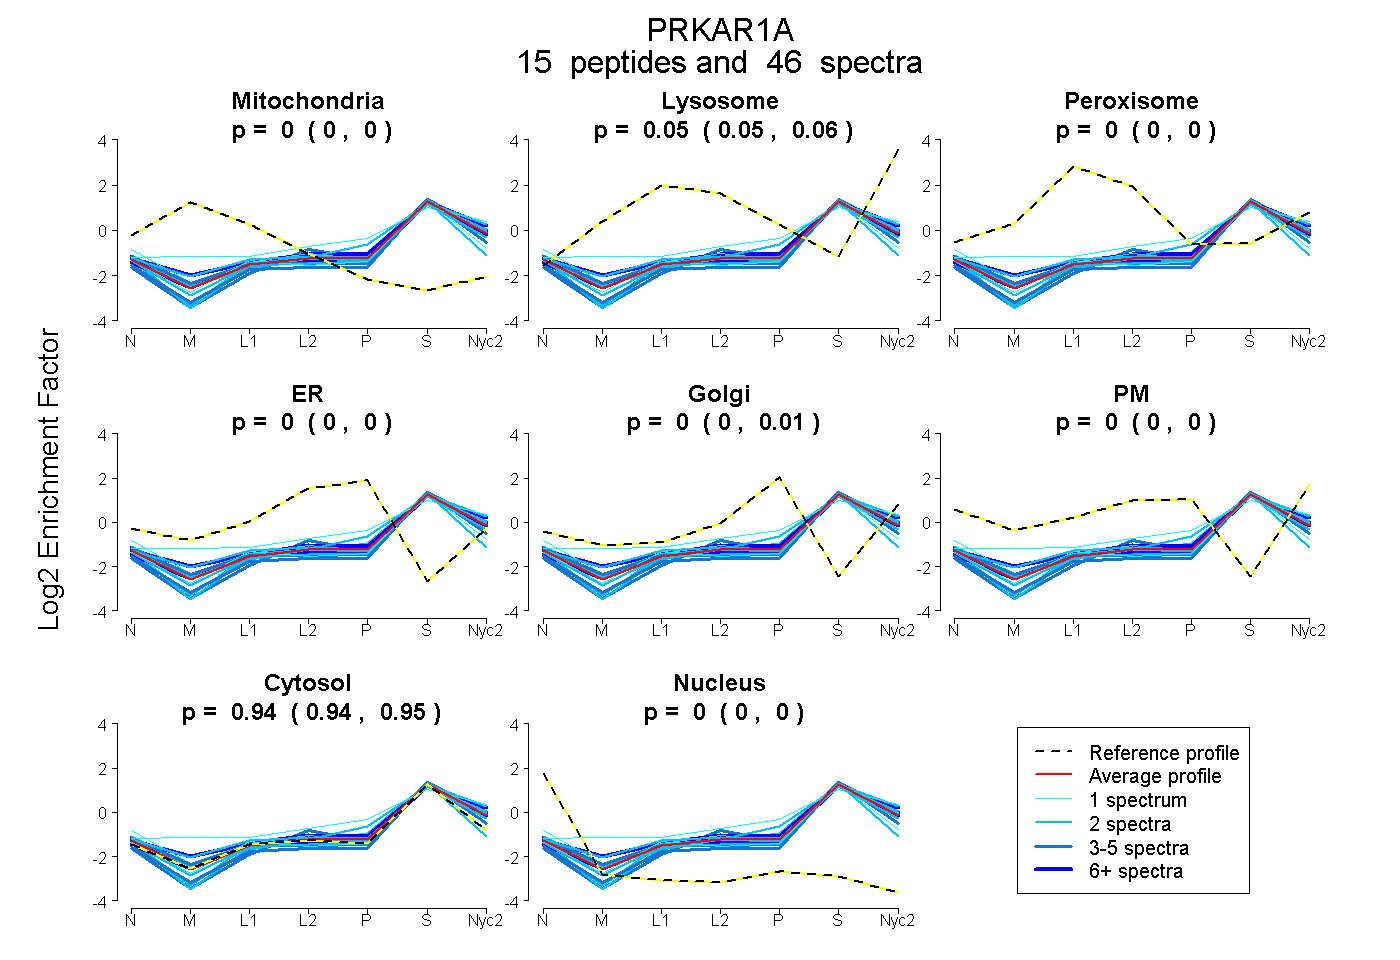
0.000 | 0.000
0.047 | 0.055
0.000 | 0.000
0.000 | 0.000
0.000 | 0.007
0.000 | 0.000
0.941 | 0.947
0.000 | 0.000
5peptides
spectra
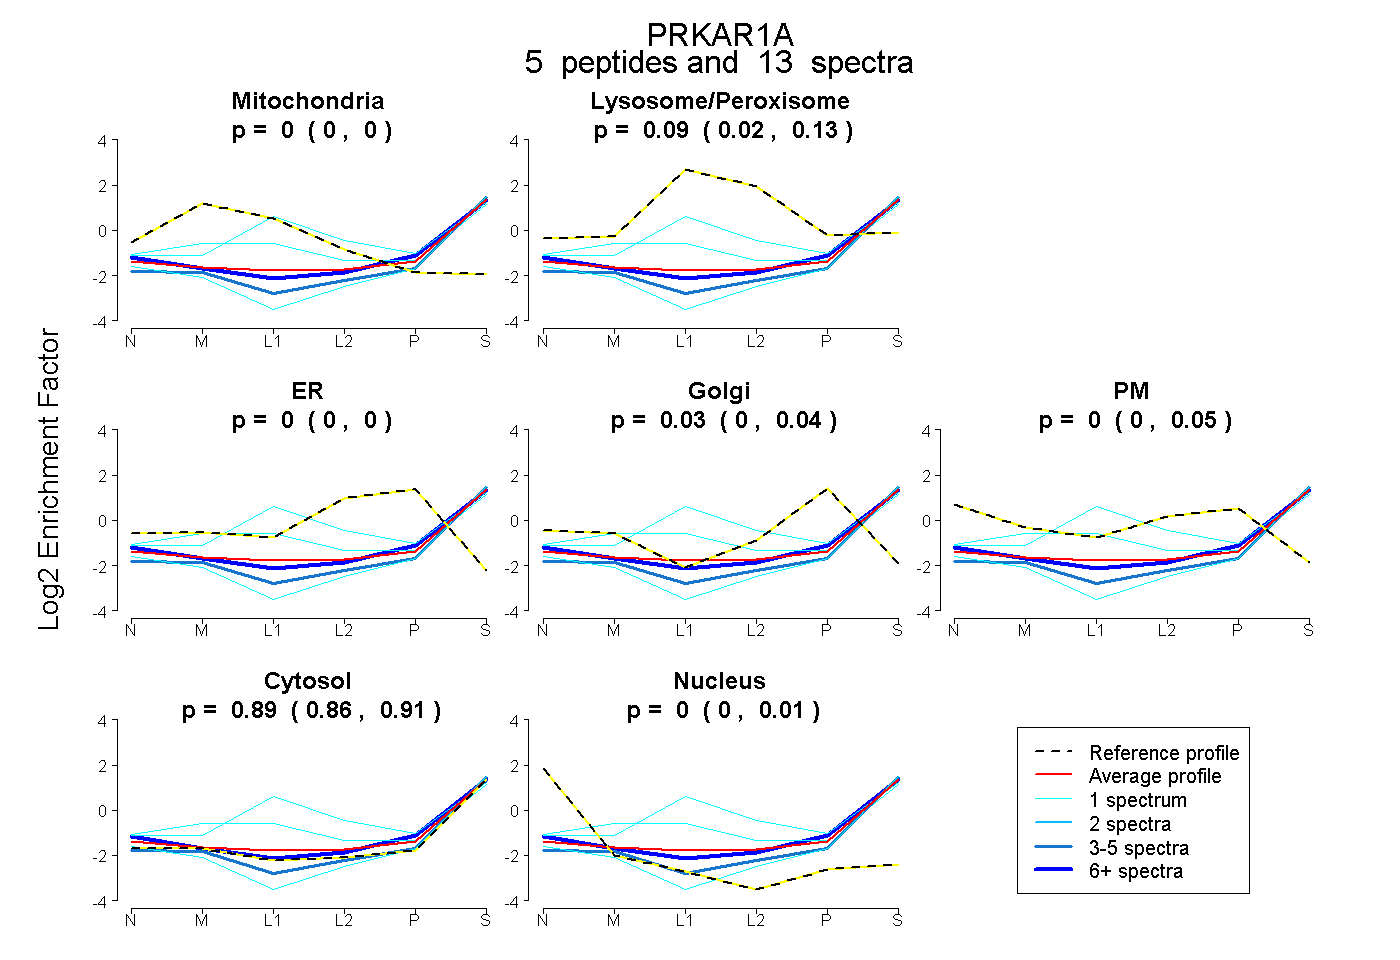
0.000 | 0.000
0.016 | 0.127
0.000 | 0.005
0.000 | 0.044
0.000 | 0.053
0.863 | 0.911
0.000 | 0.005
9peptides
spectra
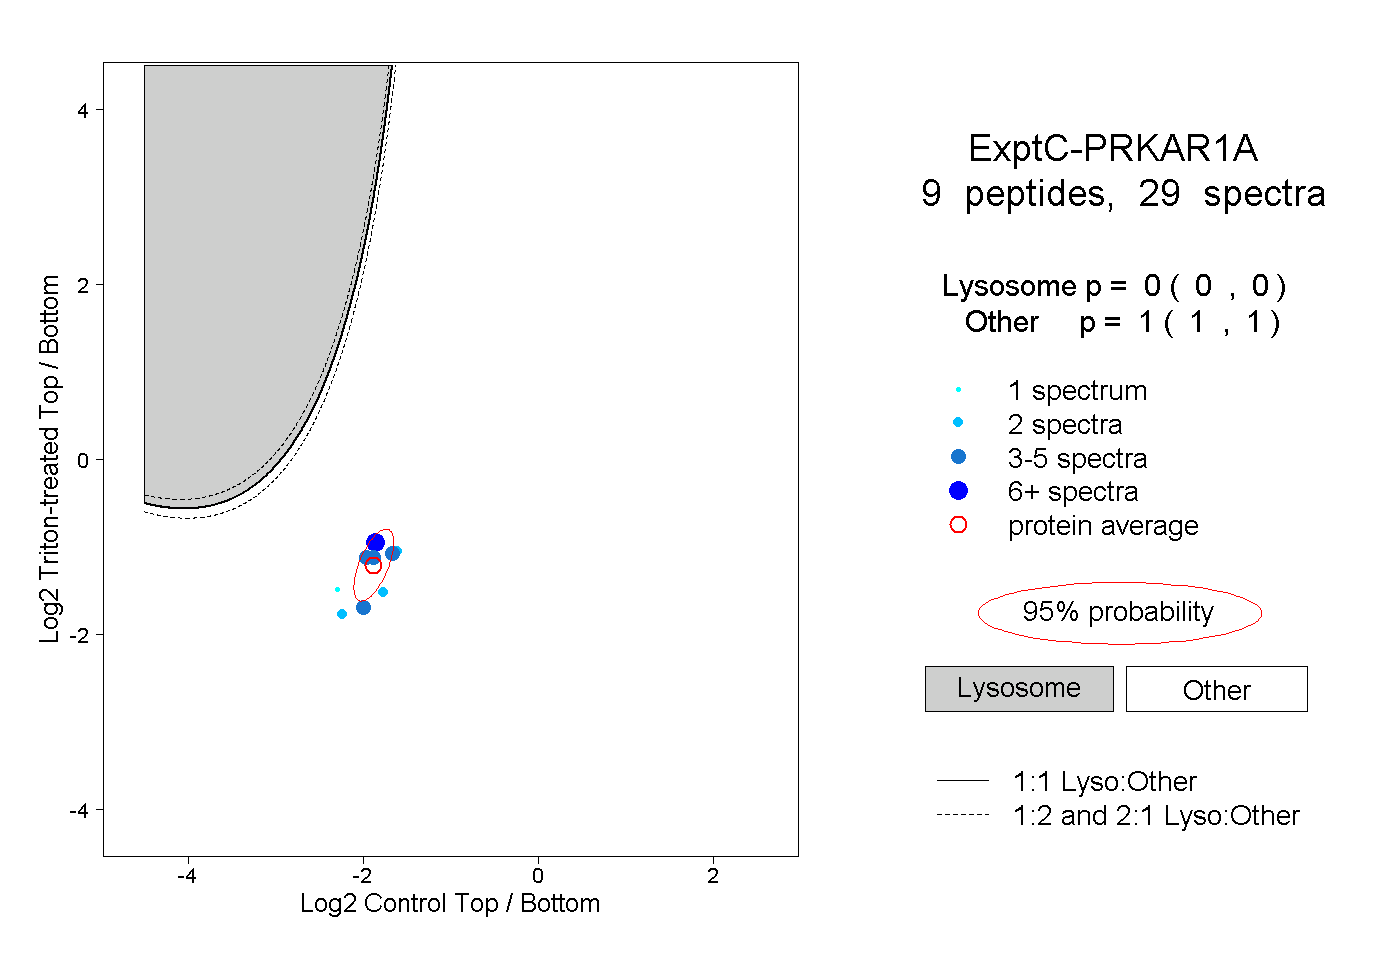
0.000 | 0.000
1.000 | 1.000
1peptide
spectrum
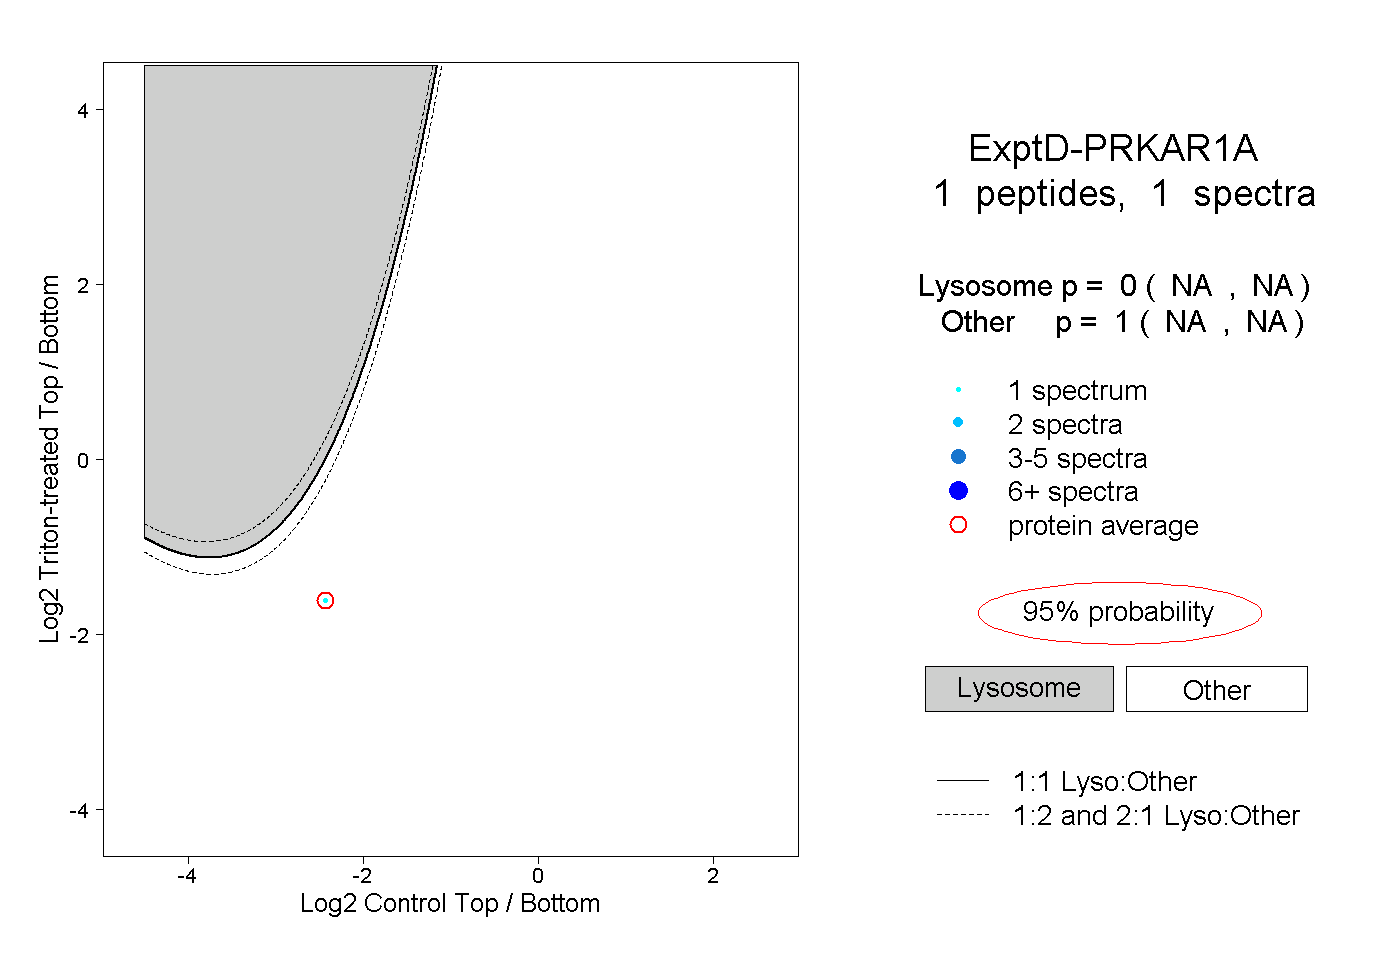
NA | NA
NA | NA