 2
2peptides
spectra
0.000 | 0.004
0.000 | 0.009
0.000 | 0.000
0.000 | 0.211
0.000 | 0.217
0.000 | 0.000
0.588 | 0.828
0.004 | 0.133
2peptides
spectra
0.000 | 0.000
1.000 | 1.000
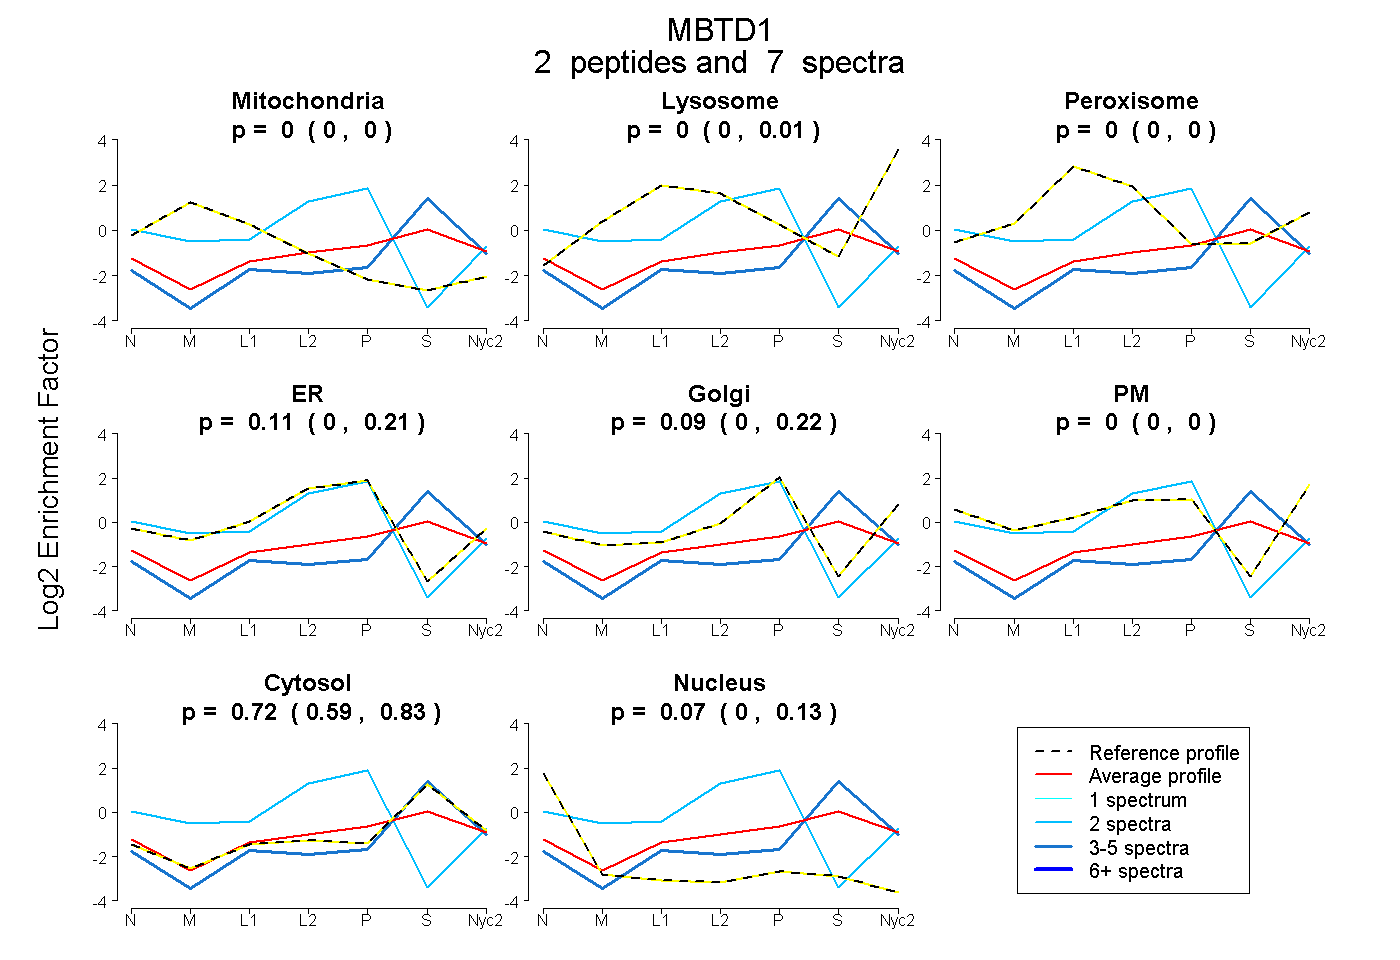
| Plot | Mito | Lyso | Perox | ER | Golgi | PM | Cytosol | Nucleus | |||||
| Expt A |
2 peptides |
7 spectra |
|
0.000 0.000 | 0.004 |
0.000 0.000 | 0.009 |
0.000 0.000 | 0.000 |
0.113 0.000 | 0.211 |
0.092 0.000 | 0.217 |
0.000 0.000 | 0.000 |
0.722 0.588 | 0.828 |
0.073 0.004 | 0.133 |
||
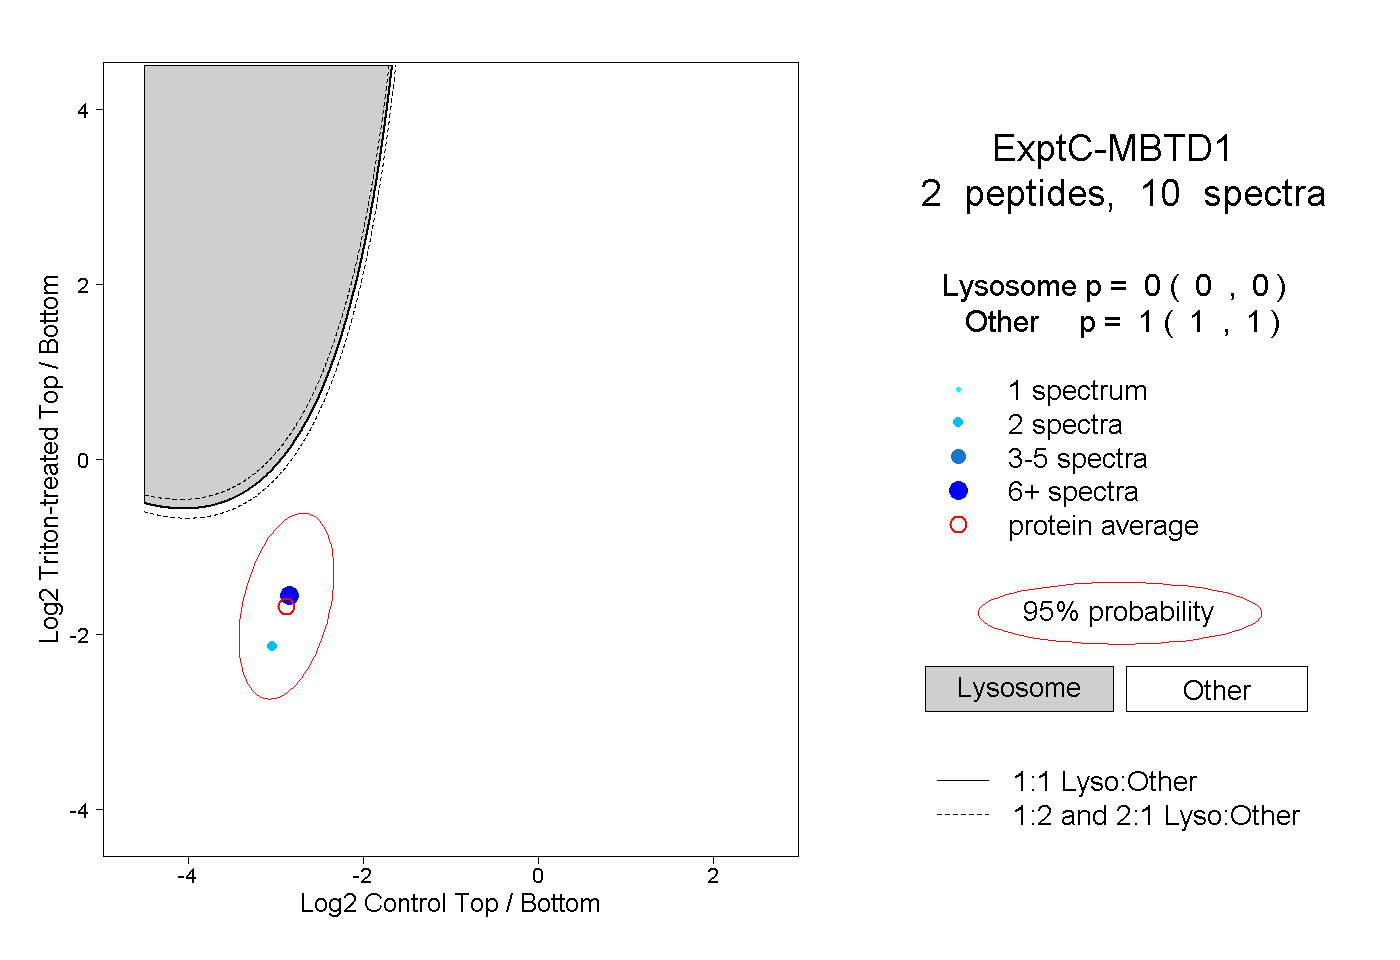
| Plot | Lyso | Other | |||||||||||
| Expt C |
2 peptides |
10 spectra |
|
0.000 0.000 | 0.000 |
1.000 1.000 | 1.000 |