 8
8peptides
spectra
0.562 | 0.578
0.125 | 0.157
0.000 | 0.013
0.000 | 0.000
0.000 | 0.000
0.267 | 0.294
0.000 | 0.000
0.000 | 0.000
| Plot | Mito | Lyso | Perox | ER | Golgi | PM | Cytosol | Nucleus | |||||
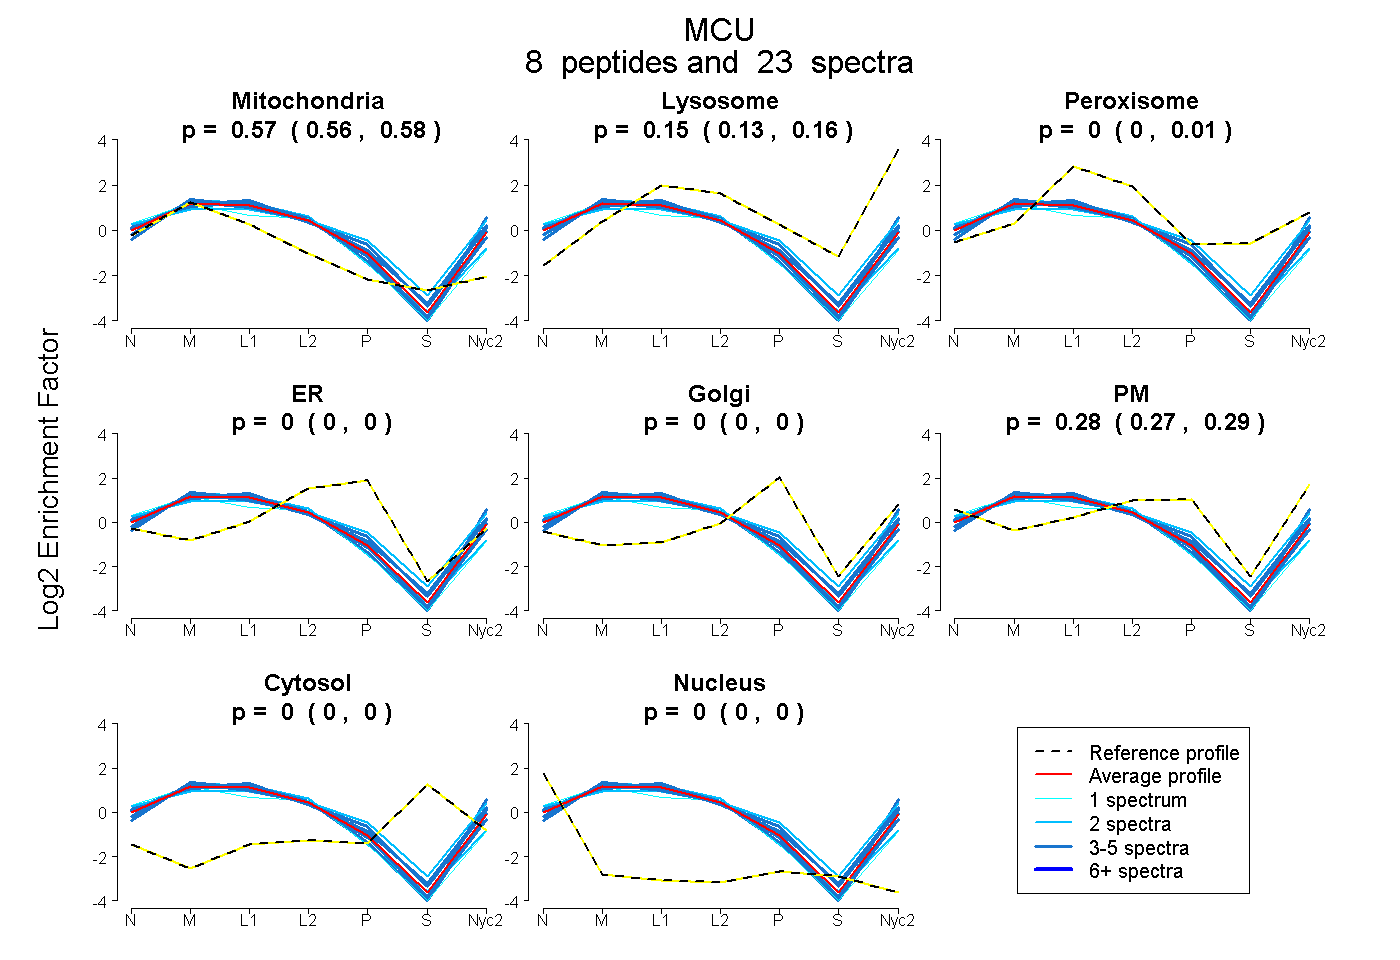
| Expt A |
8 peptides |
23 spectra |
|
0.572 0.562 | 0.578 |
0.147 0.125 | 0.157 |
0.000 0.000 | 0.013 |
0.000 0.000 | 0.000 |
0.000 0.000 | 0.000 |
0.281 0.267 | 0.294 |
0.000 0.000 | 0.000 |
0.000 0.000 | 0.000 |
| 1 spectrum, LVINDLTYHVRPPK | 0.681 | 0.000 | 0.000 | 0.017 | 0.000 | 0.302 | 0.000 | 0.000 | ||
| 3 spectra, VAIYSPDGVR | 0.510 | 0.174 | 0.056 | 0.000 | 0.000 | 0.259 | 0.000 | 0.000 | ||
| 5 spectra, QYLLFFHK | 0.620 | 0.132 | 0.000 | 0.025 | 0.000 | 0.223 | 0.000 | 0.000 | ||
| 2 spectra, CQFTLKPISDSVGVFLR | 0.656 | 0.082 | 0.124 | 0.079 | 0.000 | 0.059 | 0.000 | 0.000 | ||
| 3 spectra, DAIAQAEMDLK | 0.532 | 0.212 | 0.000 | 0.000 | 0.000 | 0.256 | 0.000 | 0.000 | ||
| 4 spectra, QEYVYPEAR | 0.485 | 0.104 | 0.049 | 0.000 | 0.000 | 0.361 | 0.000 | 0.000 | ||
| 3 spectra, DPLQVHLPLR | 0.585 | 0.175 | 0.000 | 0.030 | 0.000 | 0.210 | 0.000 | 0.000 | ||
| 2 spectra, QQLAPLEK | 0.411 | 0.099 | 0.050 | 0.000 | 0.000 | 0.440 | 0.000 | 0.000 |
| Plot | Mito | Lyso or Perox | ER | Golgi | PM | Cytosol | Nucleus | ||||||
| Expt B |
4 peptides |
8 spectra |
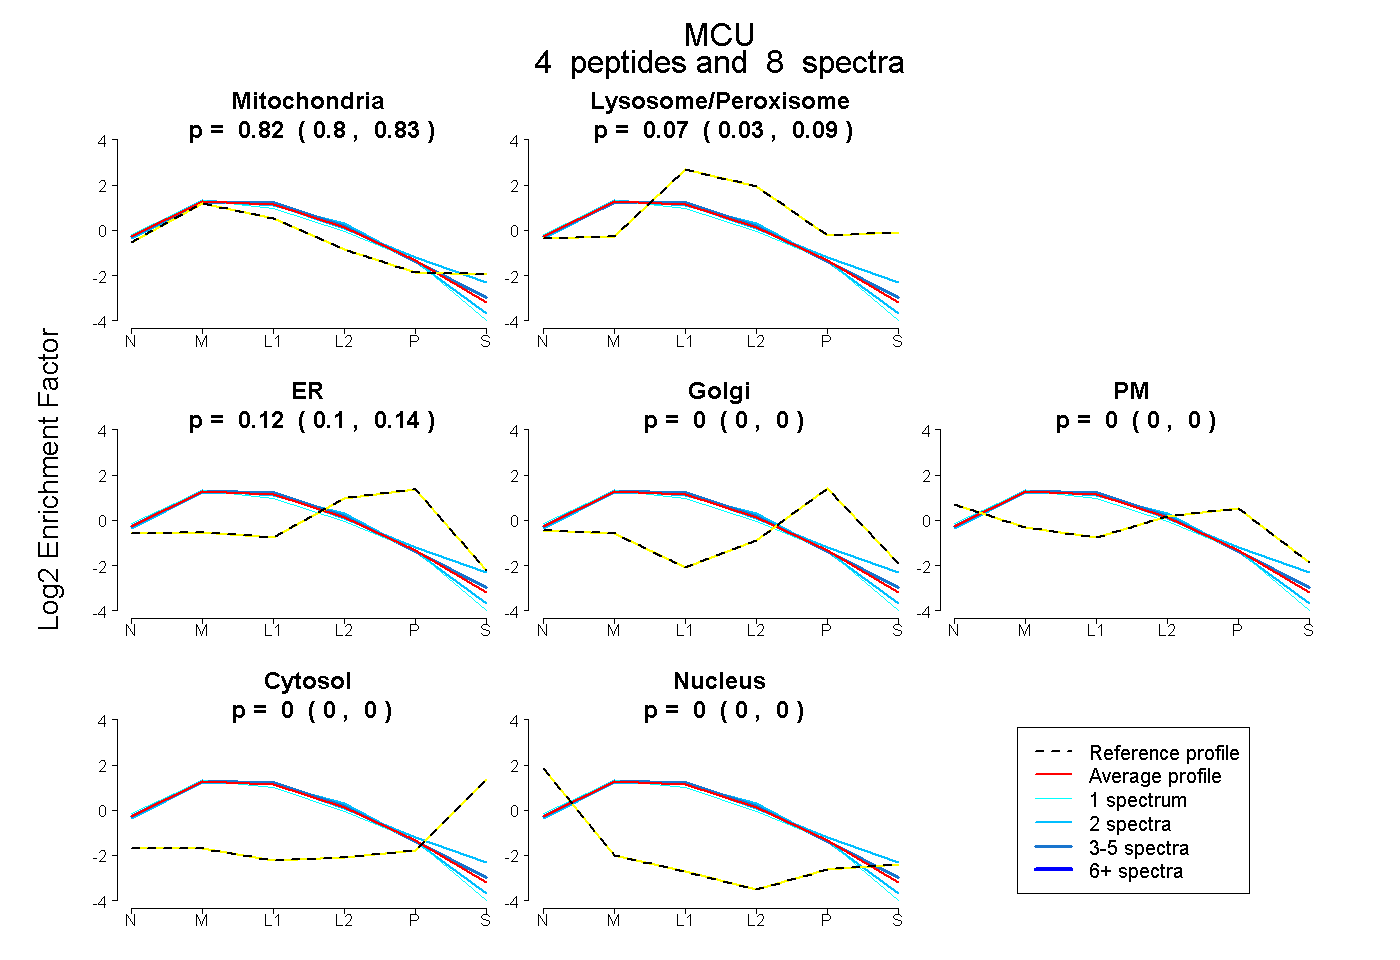 |
0.815 0.797 | 0.832 |
0.066 0.032 | 0.094 |
0.119 0.097 | 0.139 |
0.000 0.000 | 0.000 |
0.000 0.000 | 0.000 |
0.000 0.000 | 0.000 |
0.000 0.000 | 0.000 |
|||
| Plot | Lyso | Other | |||||||||||
| Expt C |
9 peptides |
80 spectra |
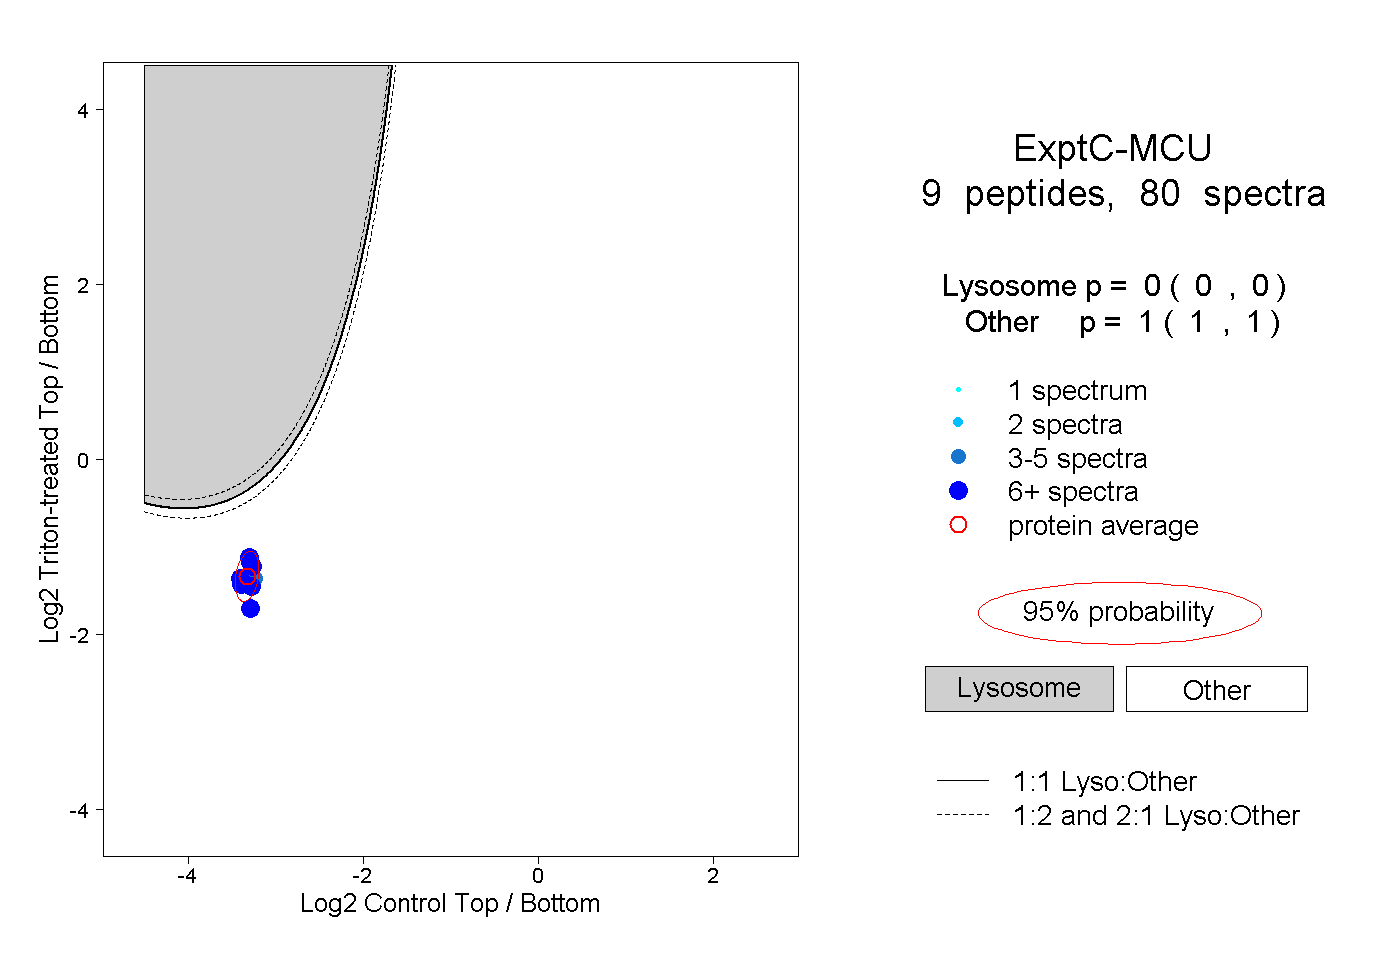 |
0.000 0.000 | 0.000 |
1.000 1.000 | 1.000 |
||||||||
| Plot | Lyso | Other | |||||||||||
| Expt D |
3 peptides |
11 spectra |
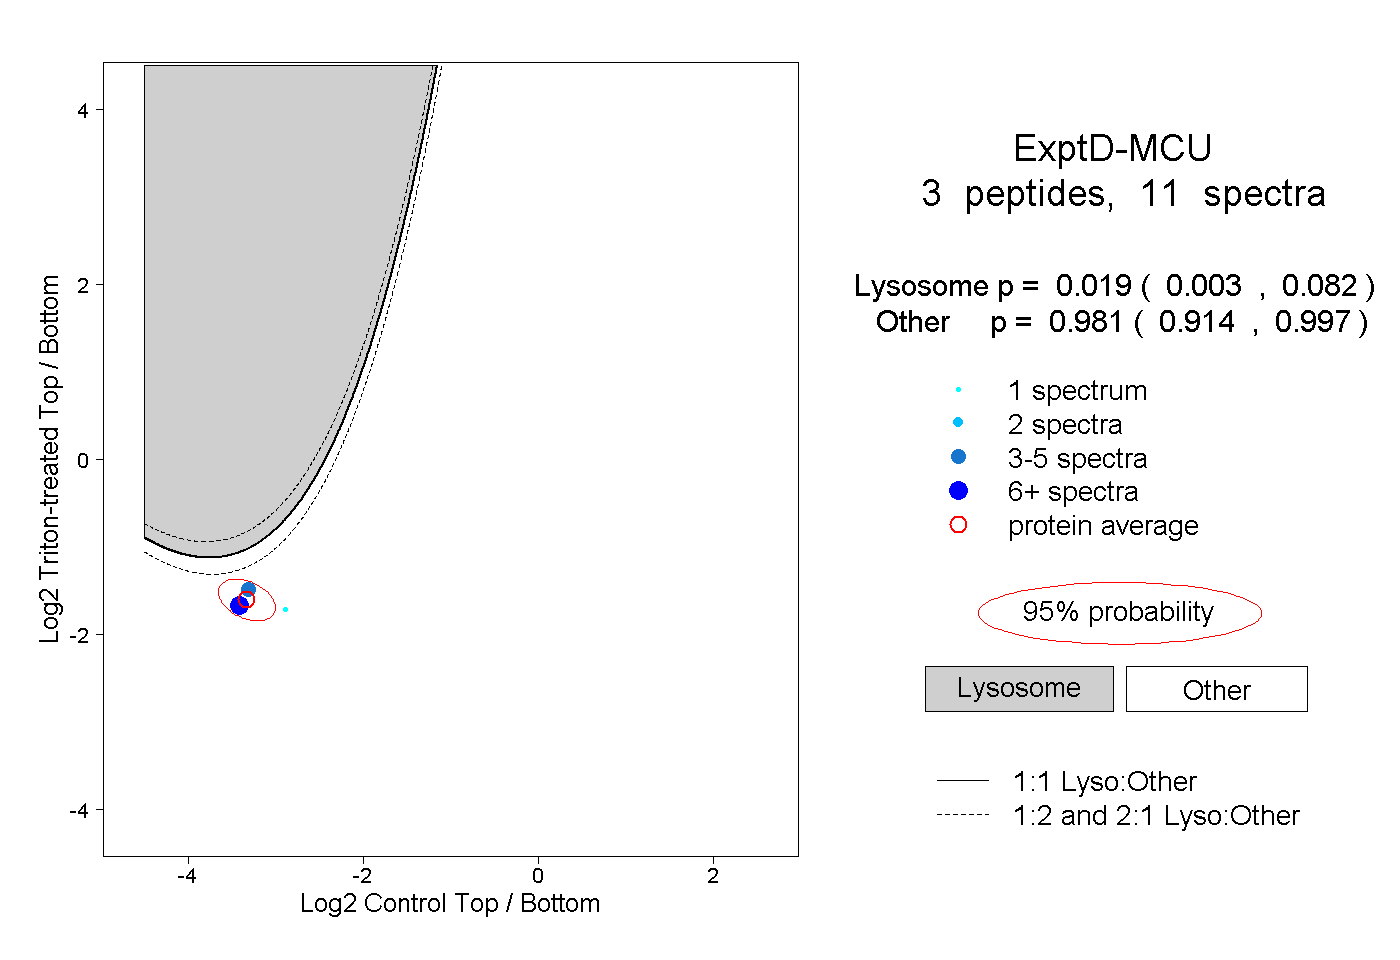 |
0.019 0.003 | 0.082 |
0.981 0.914 | 0.997 |