 3
3peptides
spectra
0.000 | 0.119
0.000 | 0.171
0.000 | 0.066
0.000 | 0.000
0.000 | 0.081
0.000 | 0.181
0.672 | 0.819
0.000 | 0.011
1peptide
spectra
NA | NA
NA | NA
| Plot | Mito | Lyso | Perox | ER | Golgi | PM | Cytosol | Nucleus | |||||
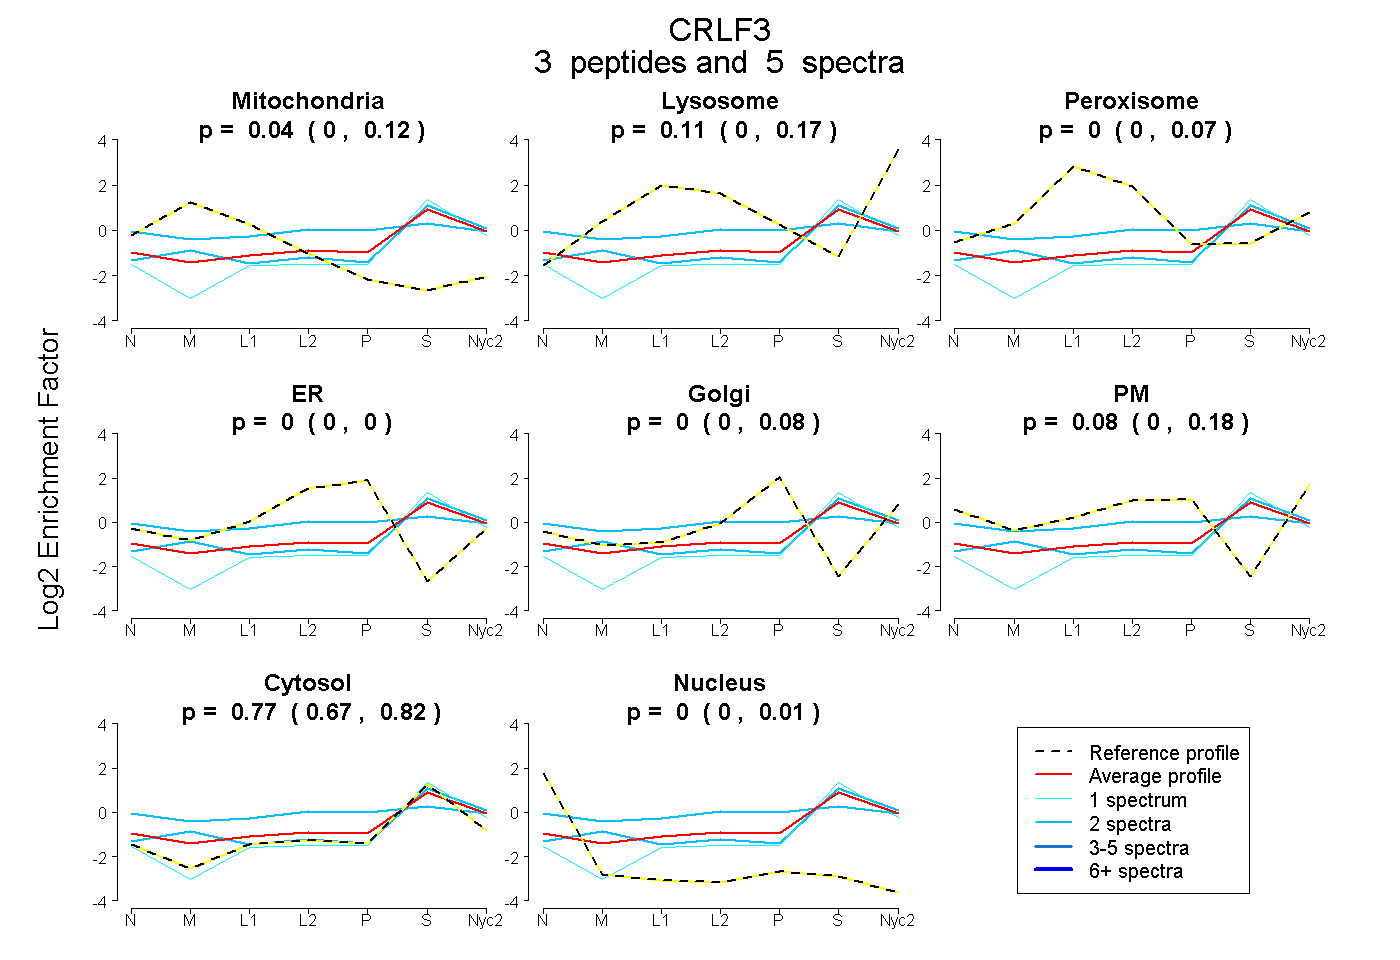
| Expt A |
3 peptides |
5 spectra |
|
0.041 0.000 | 0.119 |
0.109 0.000 | 0.171 |
0.000 0.000 | 0.066 |
0.000 0.000 | 0.000 |
0.000 0.000 | 0.081 |
0.083 0.000 | 0.181 |
0.767 0.672 | 0.819 |
0.000 0.000 | 0.011 |
||
| Plot | Lyso | Other | |||||||||||
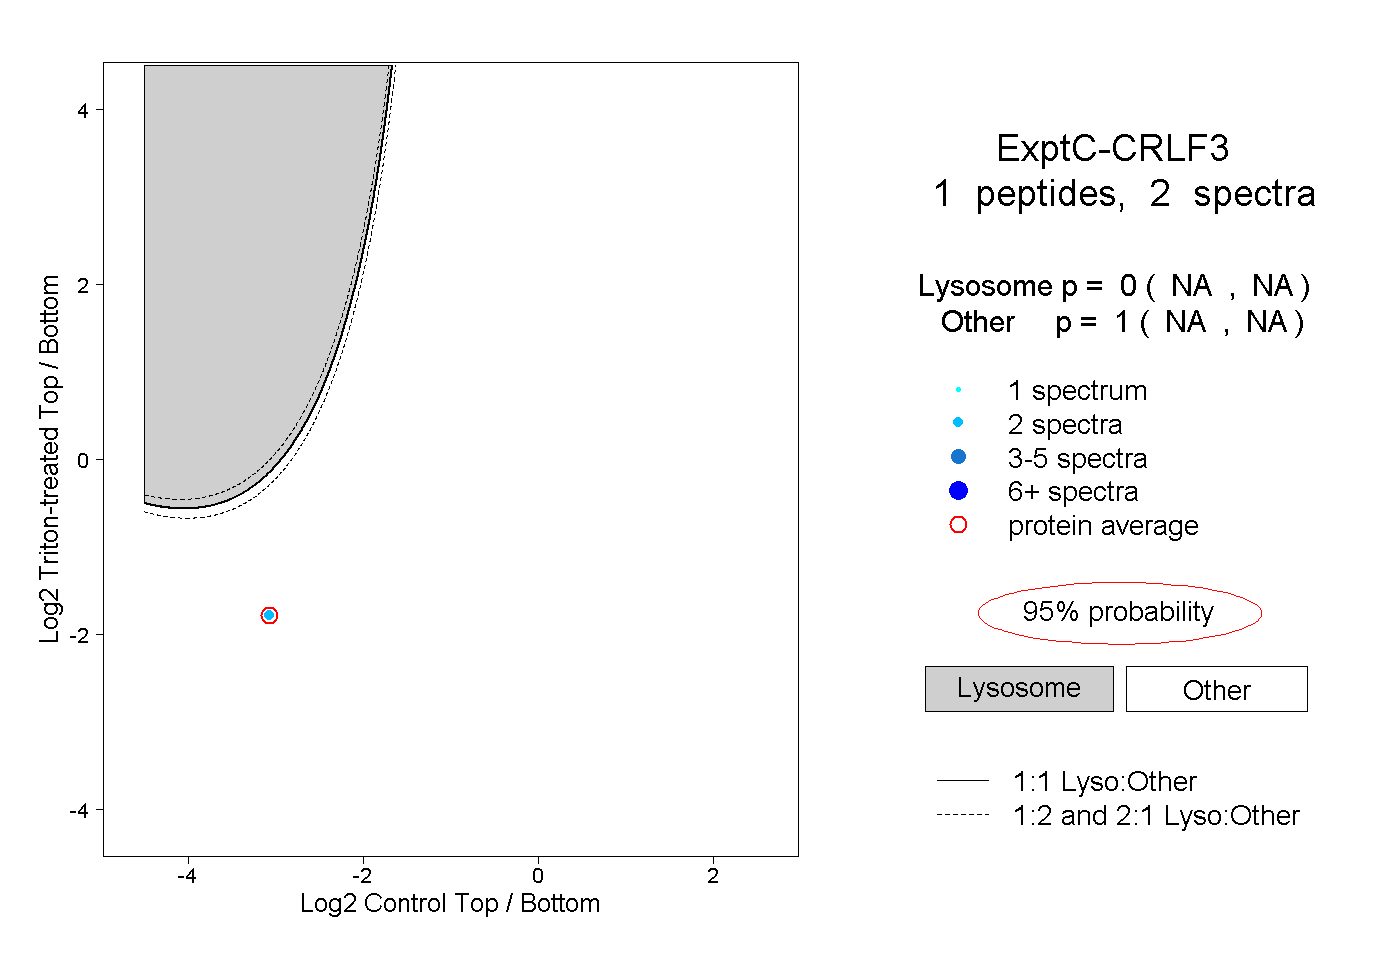
| Expt C |
1 peptide |
2 spectra |
|
0.000 NA | NA |
1.000 NA | NA |