 8
8peptides
spectra
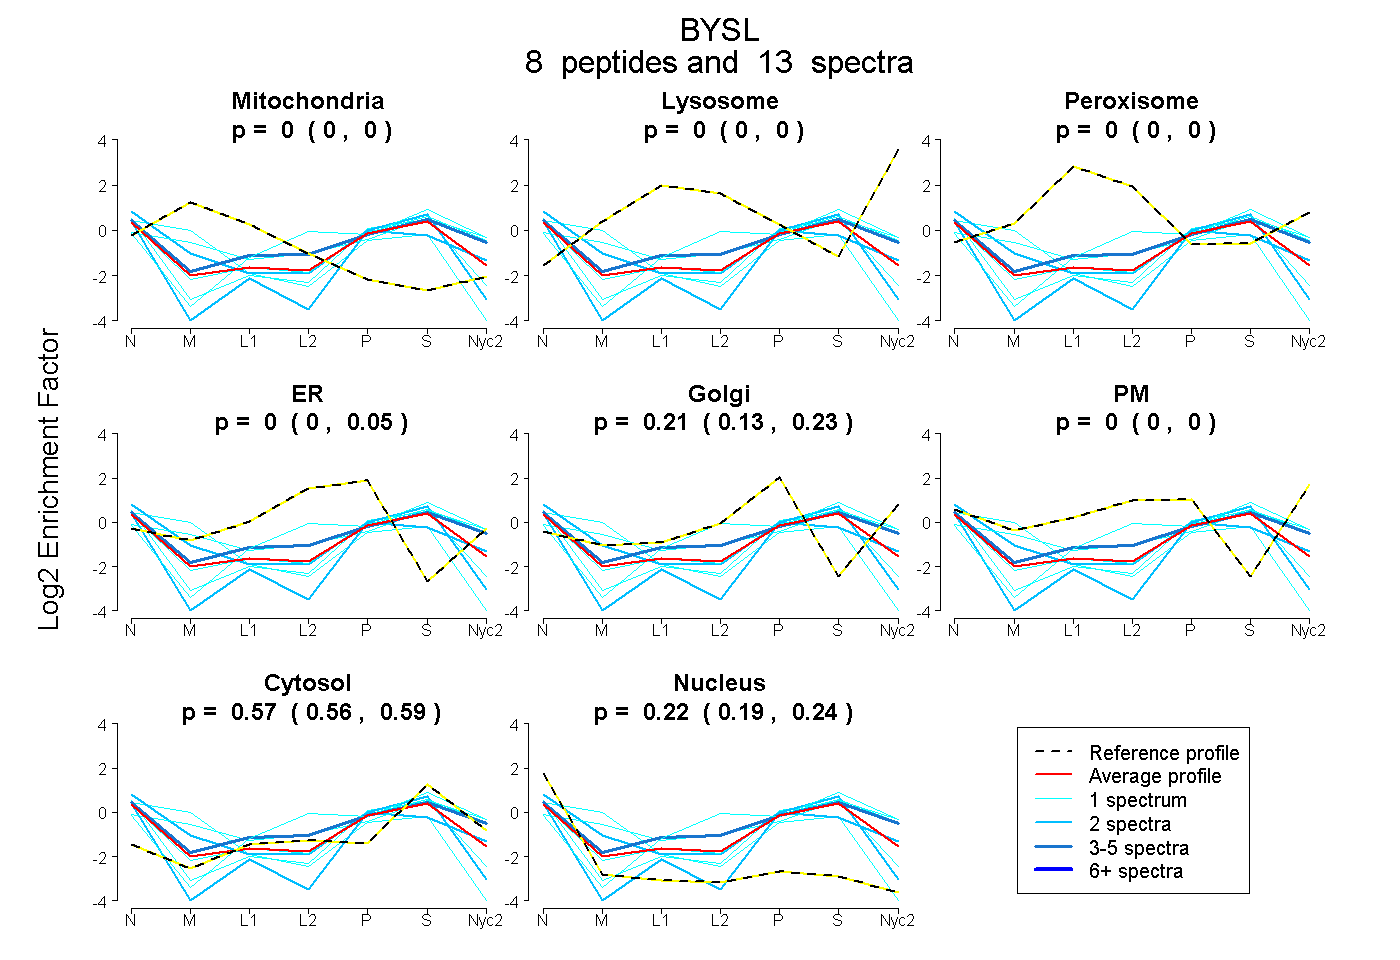
0.000 | 0.000
0.000 | 0.000
0.000 | 0.000
0.000 | 0.054
0.130 | 0.227
0.000 | 0.000
0.555 | 0.591
0.195 | 0.240
| Plot | Mito | Lyso | Perox | ER | Golgi | PM | Cytosol | Nucleus | |||||
| Expt A |
8 peptides |
13 spectra |
|
0.000 0.000 | 0.000 |
0.000 0.000 | 0.000 |
0.000 0.000 | 0.000 |
0.000 0.000 | 0.054 |
0.206 0.130 | 0.227 |
0.000 0.000 | 0.000 |
0.574 0.555 | 0.591 |
0.220 0.195 | 0.240 |
| 4 spectra, LQPHPQLSPEIR | 0.000 | 0.000 | 0.000 | 0.000 | 0.007 | 0.292 | 0.599 | 0.102 | ||
| 2 spectra, HGVEEEEEYVGPR | 0.000 | 0.000 | 0.000 | 0.000 | 0.000 | 0.000 | 0.576 | 0.424 | ||
| 1 spectrum, IFASNLK | 0.137 | 0.000 | 0.000 | 0.000 | 0.031 | 0.234 | 0.599 | 0.000 | ||
| 1 spectrum, MTVVNHQAEVVVDPEDER | 0.000 | 0.000 | 0.000 | 0.147 | 0.000 | 0.088 | 0.766 | 0.000 | ||
| 1 spectrum, IAEMEYSGASSIFLR | 0.000 | 0.000 | 0.000 | 0.000 | 0.243 | 0.007 | 0.624 | 0.127 | ||
| 2 spectra, FYNLVLLPR | 0.045 | 0.000 | 0.000 | 0.000 | 0.314 | 0.000 | 0.369 | 0.271 | ||
| 1 spectrum, ALFKPGAWFK | 0.343 | 0.000 | 0.000 | 0.000 | 0.000 | 0.000 | 0.309 | 0.348 | ||
| 1 spectrum, EALLELLR | 0.000 | 0.000 | 0.000 | 0.000 | 0.086 | 0.000 | 0.578 | 0.336 |
| Plot | Mito | Lyso or Perox | ER | Golgi | PM | Cytosol | Nucleus | ||||||
| Expt B |
1 peptide |
1 spectrum |
 |
0.000 NA | NA |
0.000 NA | NA |
0.000 NA | NA |
0.000 NA | NA |
0.232 NA | NA |
0.768 NA | NA |
0.000 NA | NA |
|||
| Plot | Lyso | Other | |||||||||||
| Expt C |
3 peptides |
5 spectra |
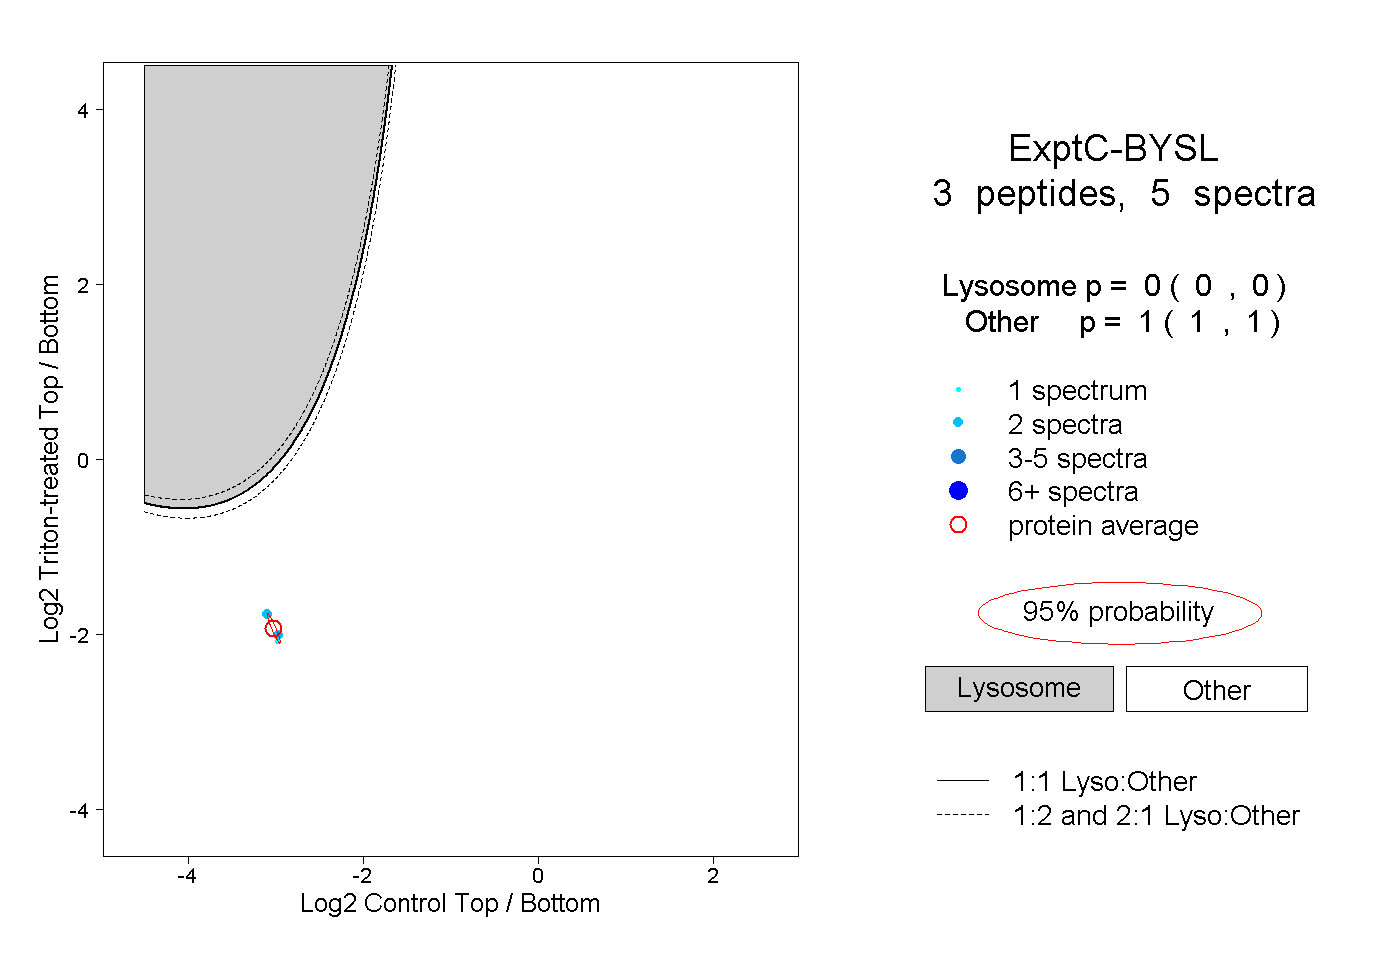 |
0.000 0.000 | 0.000 |
1.000 1.000 | 1.000 |