 5
5peptides
spectra
0.000 | 0.000
0.000 | 0.000
0.000 | 0.000
0.000 | 0.000
0.191 | 0.235
0.000 | 0.000
0.071 | 0.101
0.675 | 0.717
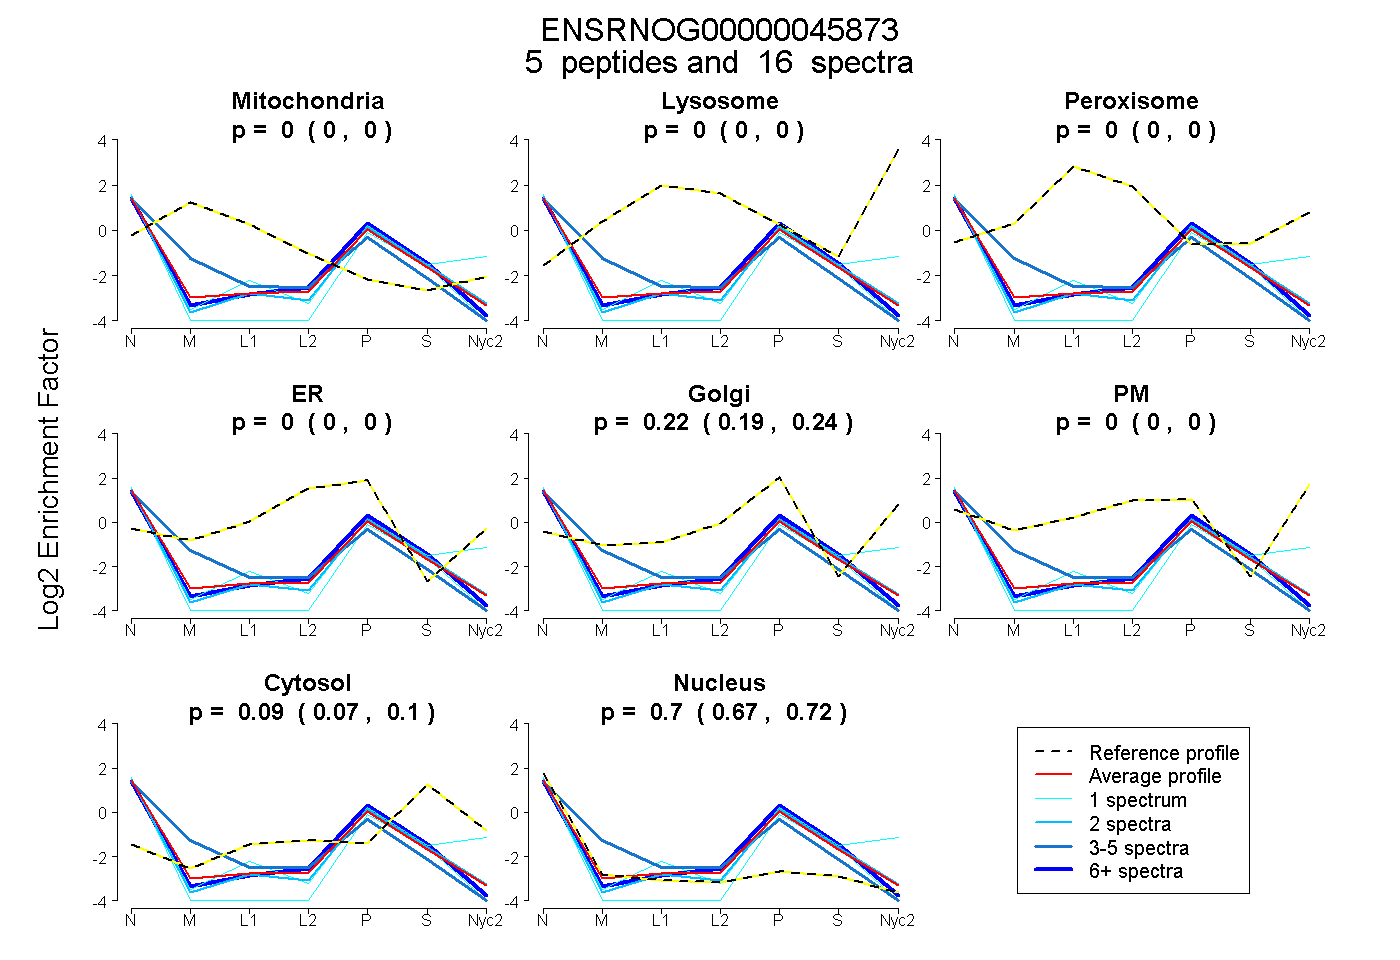
| Plot | Mito | Lyso | Perox | ER | Golgi | PM | Cytosol | Nucleus | |||||
| Expt A |
5 peptides |
16 spectra |
|
0.000 0.000 | 0.000 |
0.000 0.000 | 0.000 |
0.000 0.000 | 0.000 |
0.000 0.000 | 0.000 |
0.215 0.191 | 0.235 |
0.000 0.000 | 0.000 |
0.087 0.071 | 0.101 |
0.698 0.675 | 0.717 |
| 8 spectra, ASMQQQQQLASAR | 0.000 | 0.000 | 0.000 | 0.035 | 0.151 | 0.000 | 0.119 | 0.696 | ||
| 2 spectra, SNIQAR | 0.000 | 0.000 | 0.000 | 0.000 | 0.177 | 0.000 | 0.110 | 0.713 | ||
| 4 spectra, LGRPIGALAR | 0.052 | 0.000 | 0.000 | 0.223 | 0.000 | 0.000 | 0.000 | 0.725 | ||
| 1 spectrum, LAQQMENRPSVQAALK | 0.000 | 0.000 | 0.000 | 0.000 | 0.016 | 0.000 | 0.096 | 0.889 | ||
| 1 spectrum, FTNMLK | 0.000 | 0.000 | 0.000 | 0.000 | 0.320 | 0.000 | 0.151 | 0.529 |