 3
3peptides
spectra
0.000 | 0.000
0.000 | 0.000
0.000 | 0.000
0.060 | 0.359
0.000 | 0.234
0.000 | 0.149
0.442 | 0.496
0.112 | 0.176
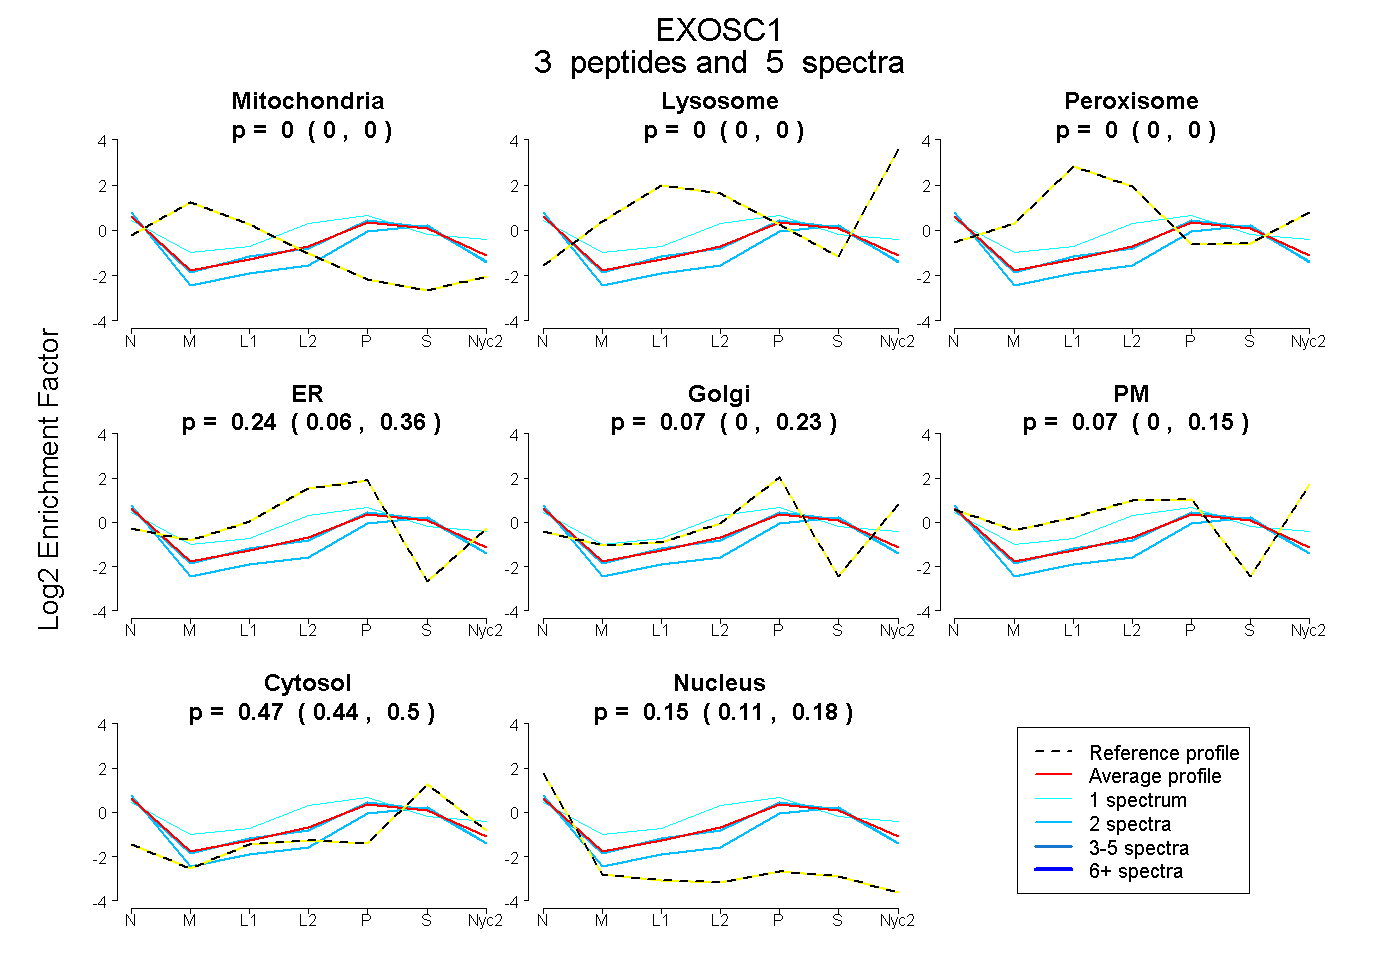
| Plot | Mito | Lyso | Perox | ER | Golgi | PM | Cytosol | Nucleus | |||||
| Expt A |
3 peptides |
5 spectra |
|
0.000 0.000 | 0.000 |
0.000 0.000 | 0.000 |
0.000 0.000 | 0.000 |
0.239 0.060 | 0.359 |
0.070 0.000 | 0.234 |
0.070 0.000 | 0.149 |
0.474 0.442 | 0.496 |
0.146 0.112 | 0.176 |
| 2 spectra, YCIPGER | 0.000 | 0.000 | 0.000 | 0.315 | 0.045 | 0.000 | 0.482 | 0.158 | ||
| 2 spectra, SFRPGDIVLAK | 0.000 | 0.000 | 0.000 | 0.000 | 0.231 | 0.000 | 0.511 | 0.258 | ||
| 1 spectrum, VHILYVGSTPLK | 0.000 | 0.000 | 0.017 | 0.309 | 0.000 | 0.247 | 0.406 | 0.021 |