 3
3peptides
spectra
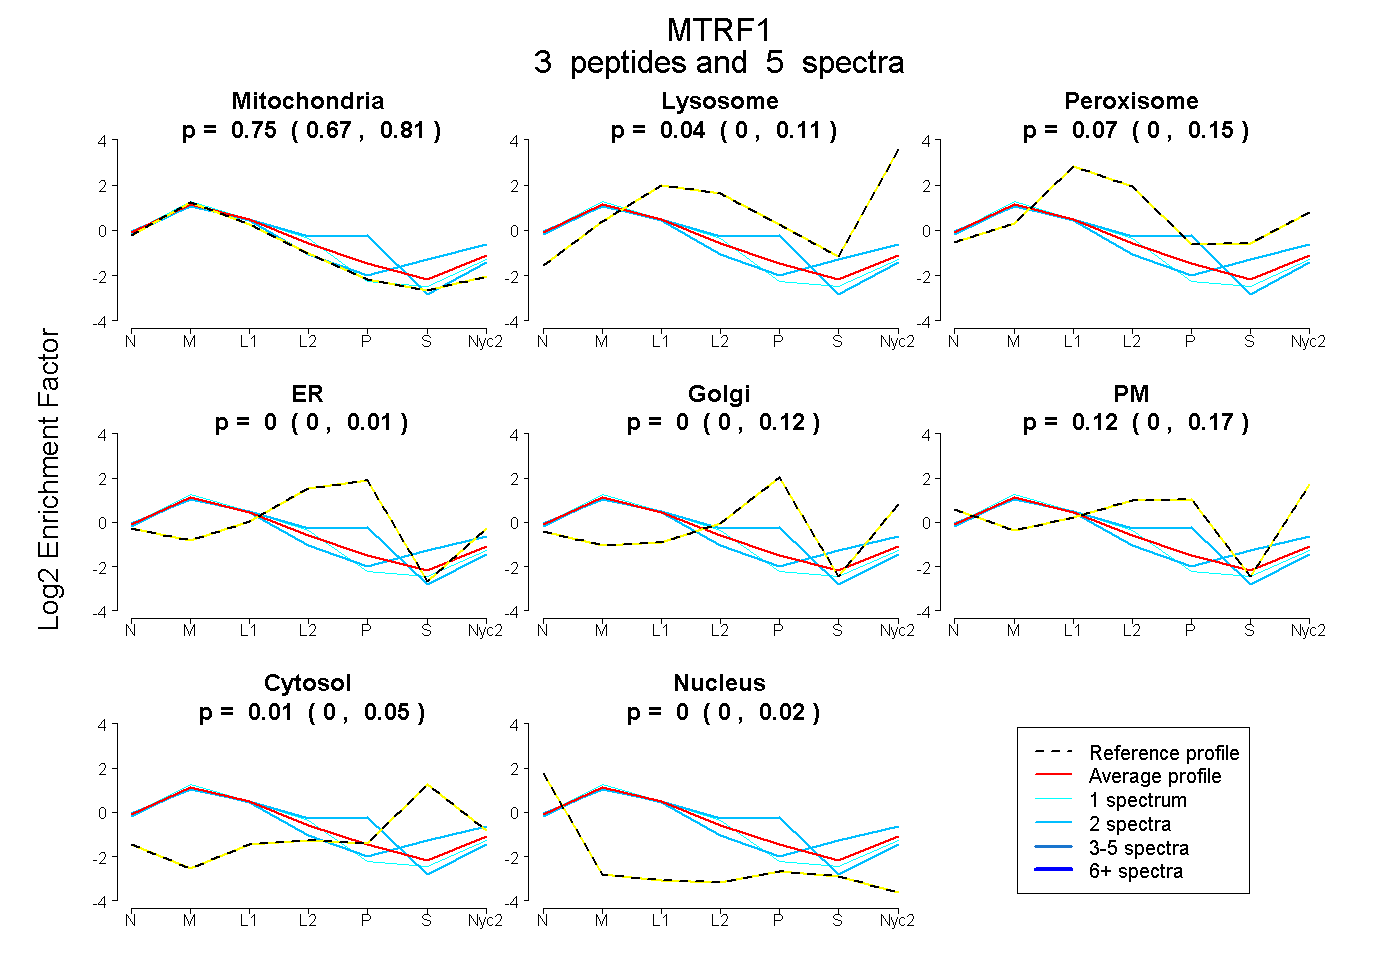
0.666 | 0.807
0.000 | 0.109
0.000 | 0.152
0.000 | 0.014
0.000 | 0.124
0.000 | 0.166
0.000 | 0.051
0.000 | 0.015
9peptides
spectra
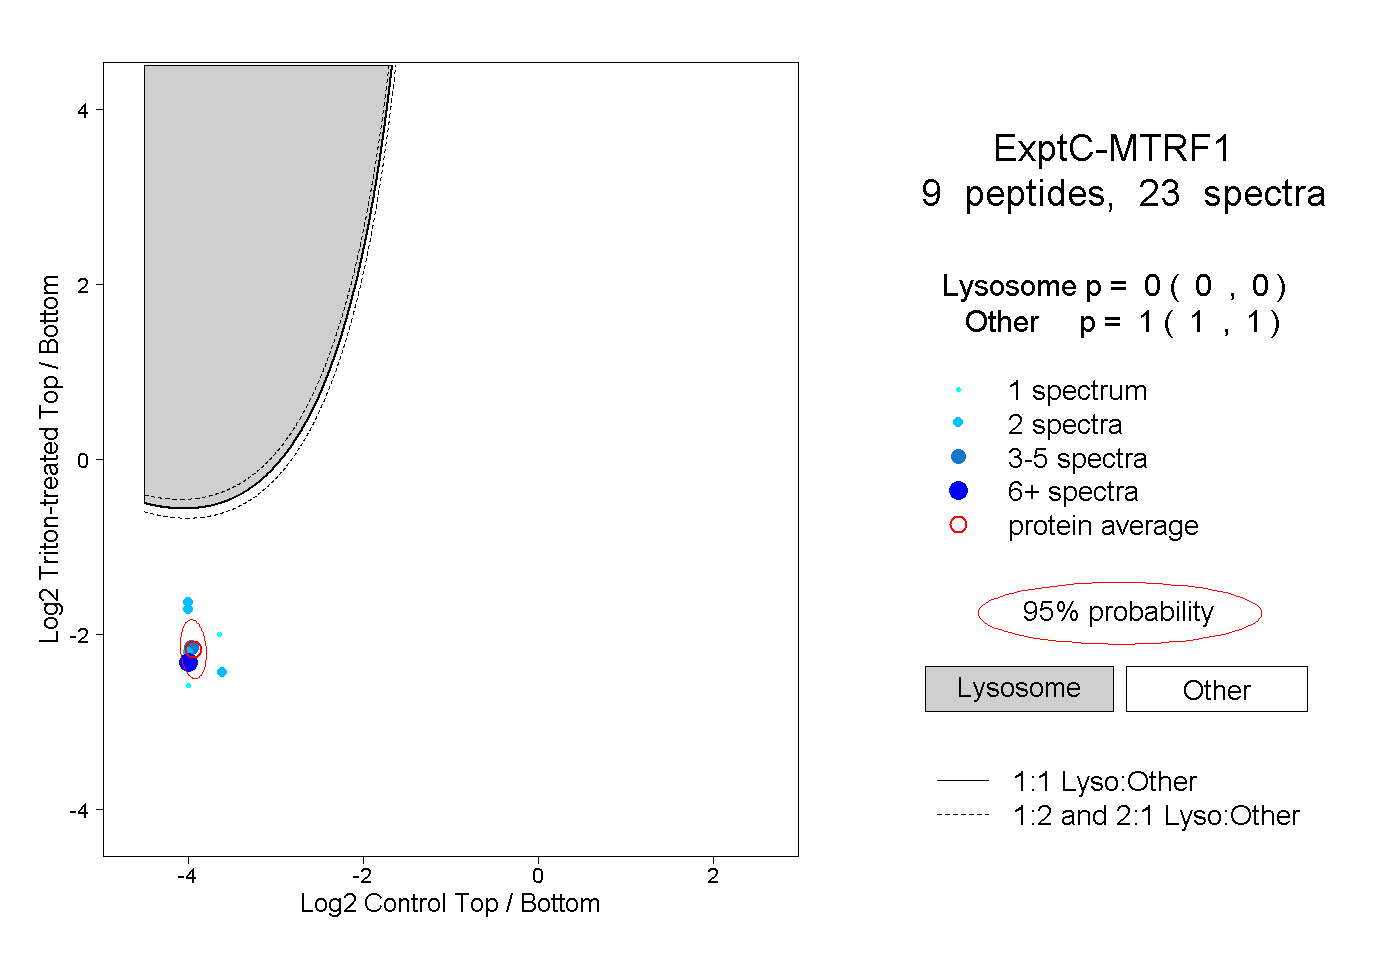
0.000 | 0.000
1.000 | 1.000
1peptide
spectrum
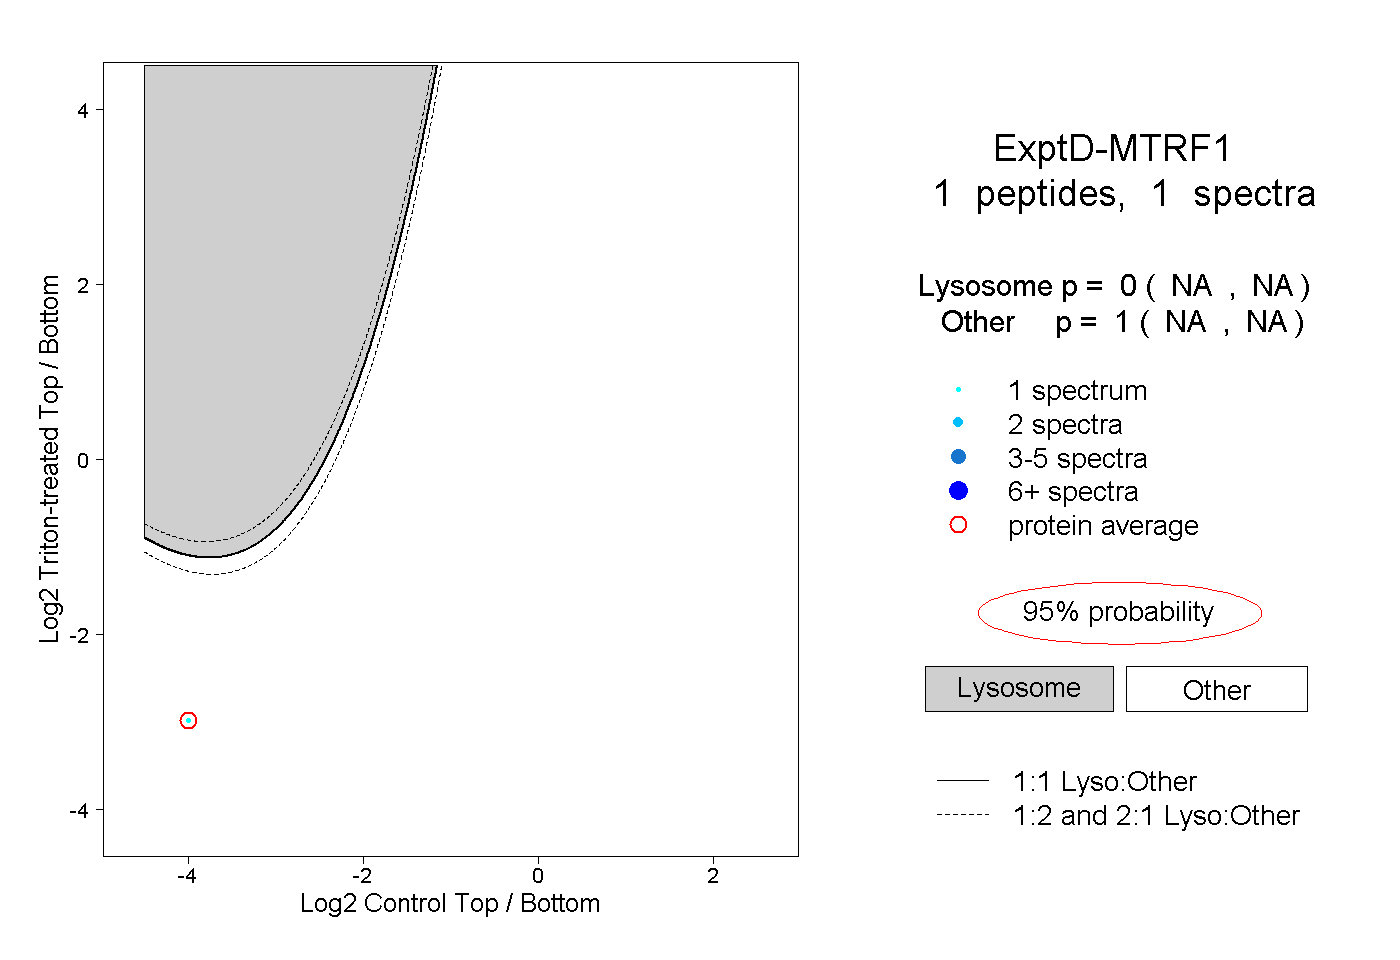
NA | NA
NA | NA