 5
5peptides
spectra
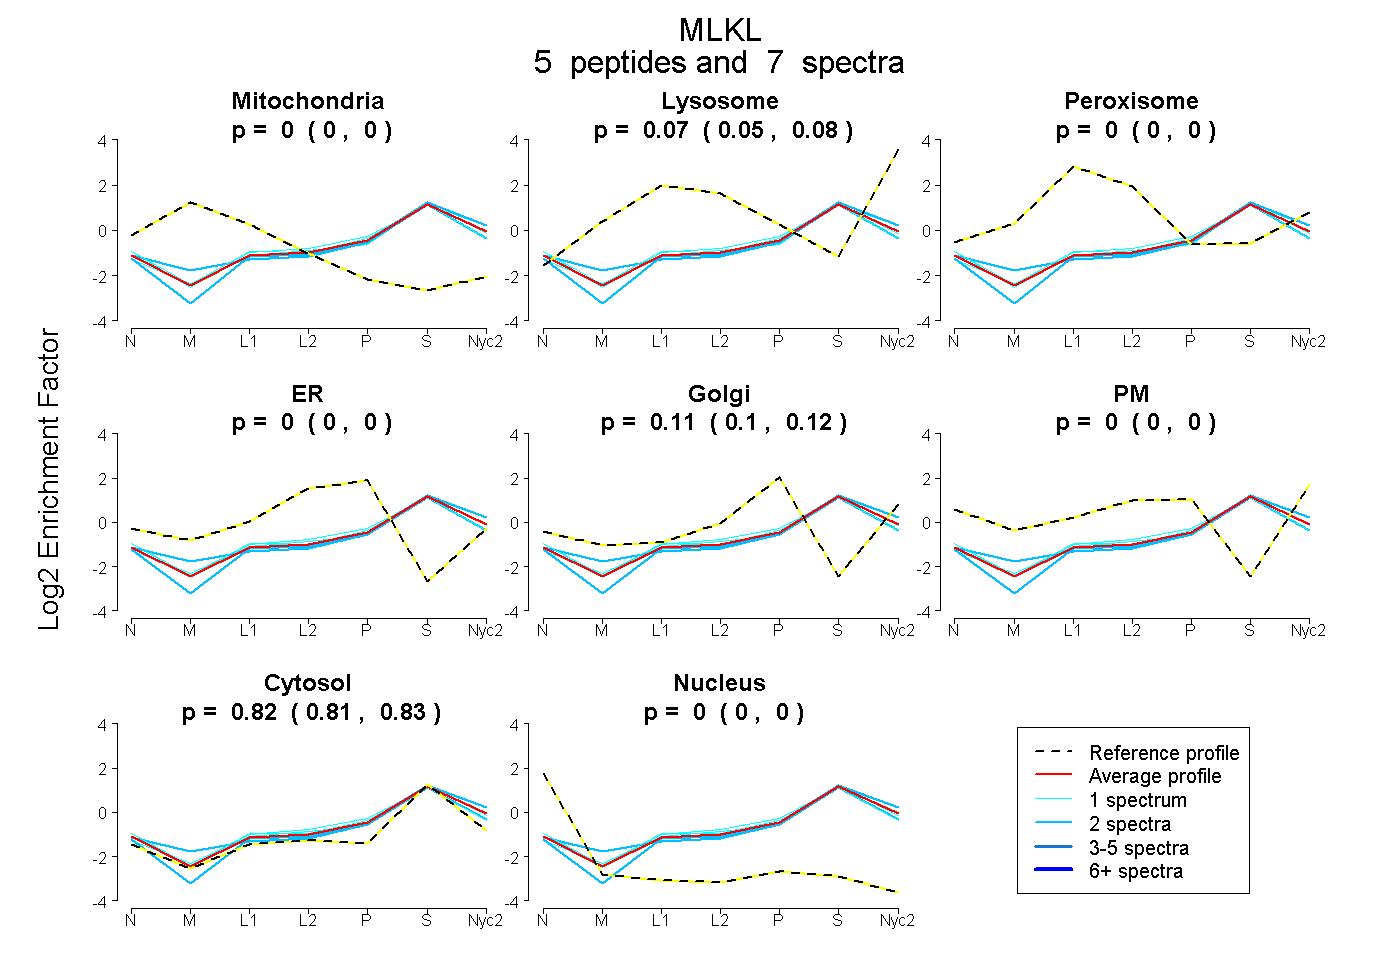
0.000 | 0.000
0.050 | 0.079
0.000 | 0.000
0.000 | 0.000
0.102 | 0.122
0.000 | 0.000
0.810 | 0.831
0.000 | 0.000
| Plot | Mito | Lyso | Perox | ER | Golgi | PM | Cytosol | Nucleus | |||||
| Expt A |
5 peptides |
7 spectra |
|
0.000 0.000 | 0.000 |
0.065 0.050 | 0.079 |
0.000 0.000 | 0.000 |
0.000 0.000 | 0.000 |
0.113 0.102 | 0.122 |
0.000 0.000 | 0.000 |
0.822 0.810 | 0.831 |
0.000 0.000 | 0.000 |
| 1 spectrum, AESVGIVR | 0.000 | 0.094 | 0.000 | 0.000 | 0.066 | 0.000 | 0.839 | 0.000 | ||
| 1 spectrum, FEDVLK | 0.000 | 0.102 | 0.000 | 0.000 | 0.129 | 0.000 | 0.769 | 0.000 | ||
| 2 spectra, SLPSDITAALGR | 0.000 | 0.051 | 0.000 | 0.000 | 0.092 | 0.000 | 0.857 | 0.000 | ||
| 1 spectrum, LQISMEEIK | 0.000 | 0.007 | 0.044 | 0.000 | 0.146 | 0.000 | 0.803 | 0.000 | ||
| 2 spectra, ILFHEVNEK | 0.000 | 0.051 | 0.000 | 0.000 | 0.129 | 0.000 | 0.820 | 0.000 |
| Plot | Lyso | Other | |||||||||||
| Expt C |
9 peptides |
18 spectra |
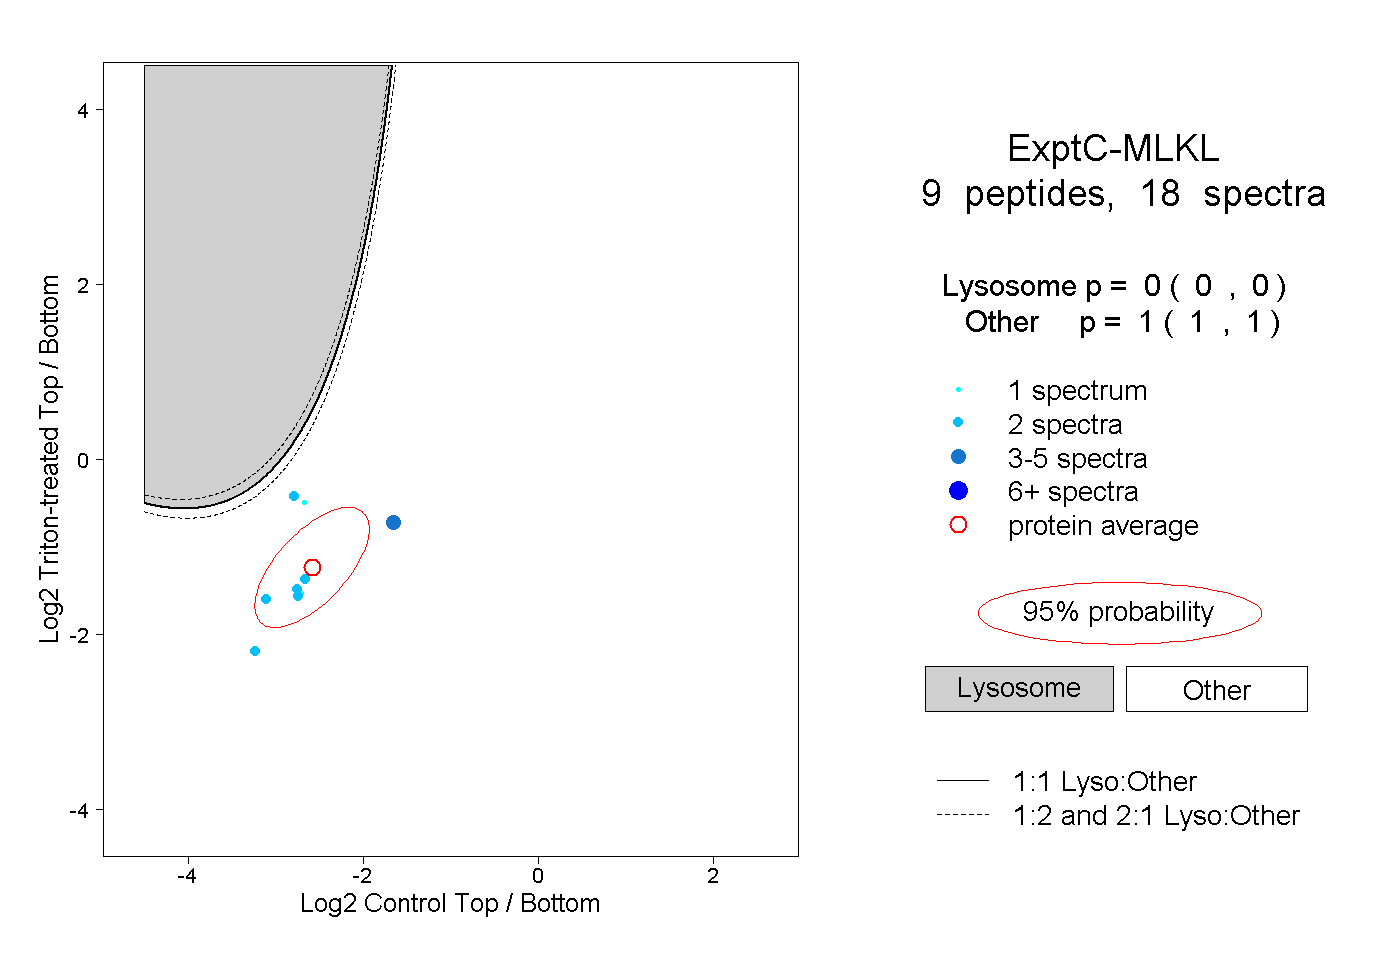 |
0.000 0.000 | 0.000 |
1.000 1.000 | 1.000 |