 2
2peptides
spectra
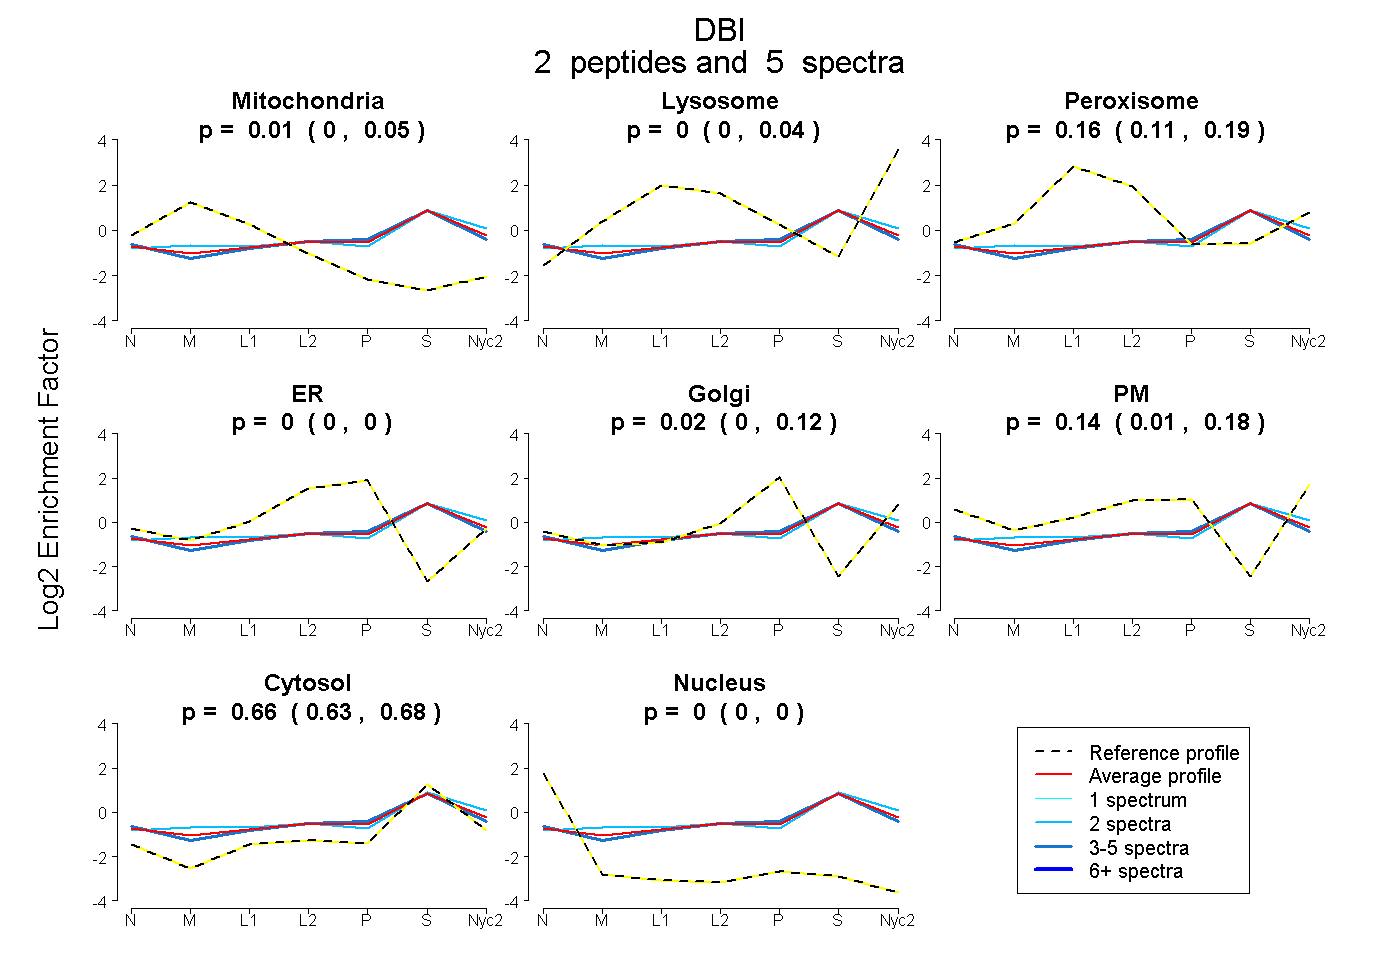
0.000 | 0.045
0.000 | 0.043
0.109 | 0.188
0.000 | 0.000
0.000 | 0.116
0.015 | 0.184
0.629 | 0.684
0.000 | 0.000
2peptides
spectra
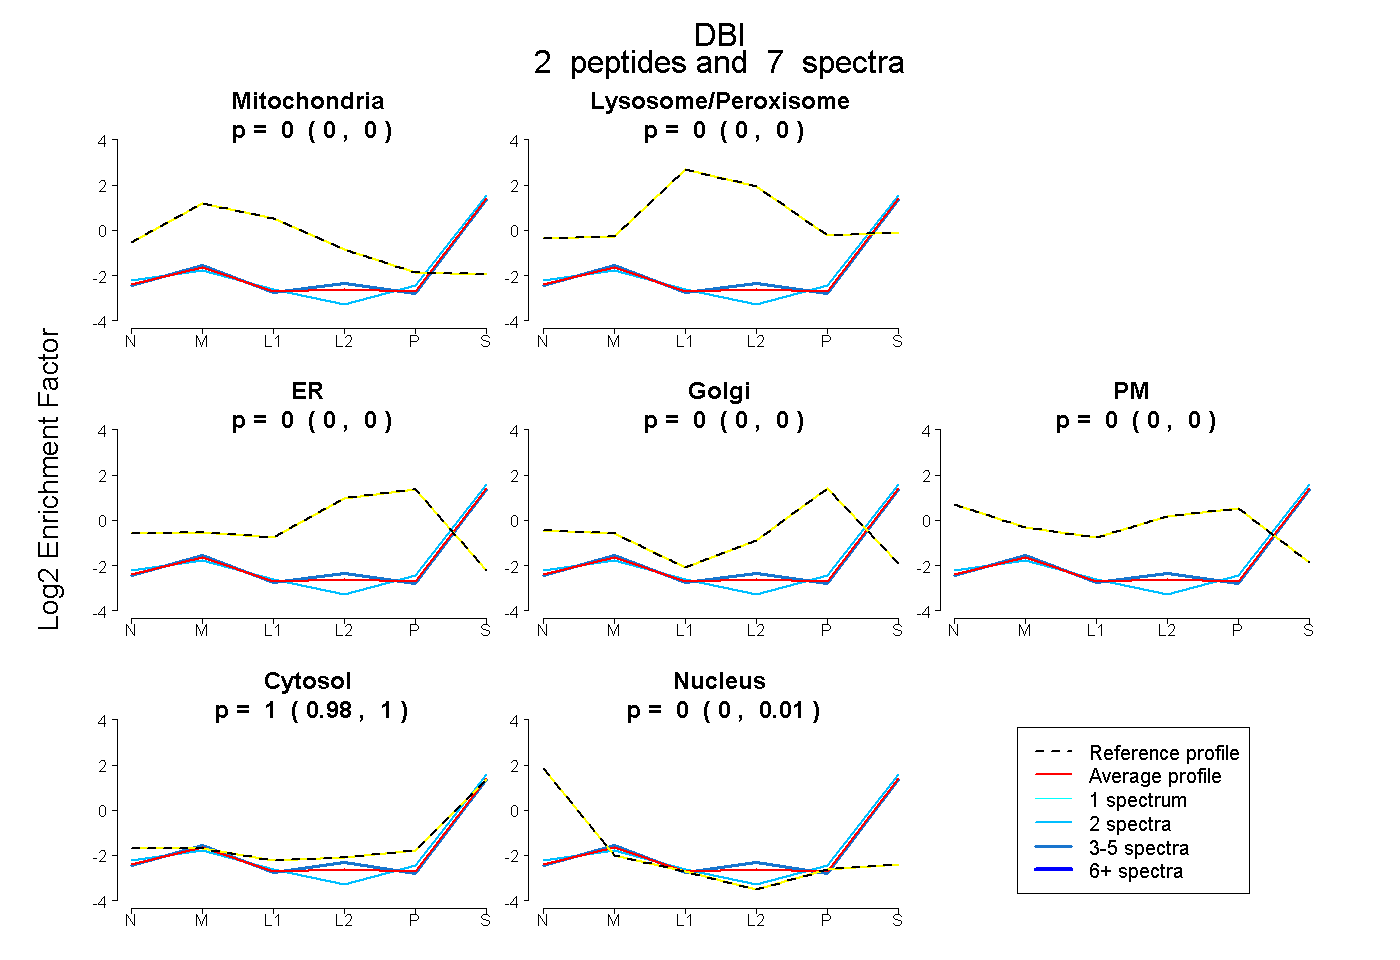
0.000 | 0.000
0.000 | 0.000
0.000 | 0.000
0.000 | 0.000
0.000 | 0.000
0.981 | 1.000
0.000 | 0.012
5peptides
spectra
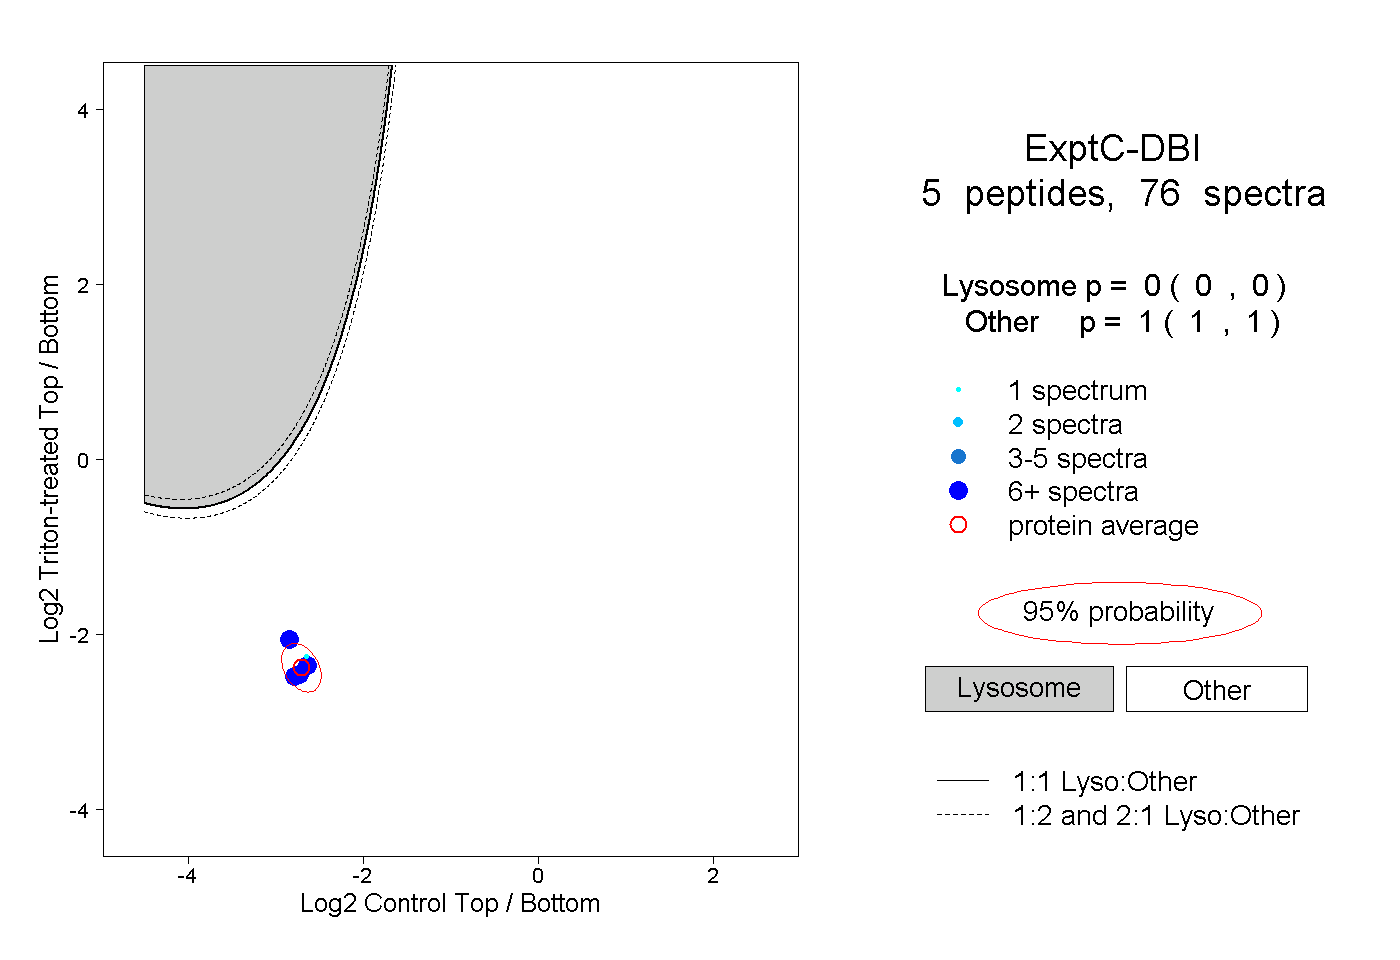
0.000 | 0.000
1.000 | 1.000