 1
1peptide
spectra
0.000 | 0.000
0.392 | 0.541
0.010 | 0.157
0.000 | 0.000
0.178 | 0.350
0.013 | 0.287
0.000 | 0.000
0.000 | 0.000
2peptides
spectra
0.000 | 0.000
1.000 | 1.000
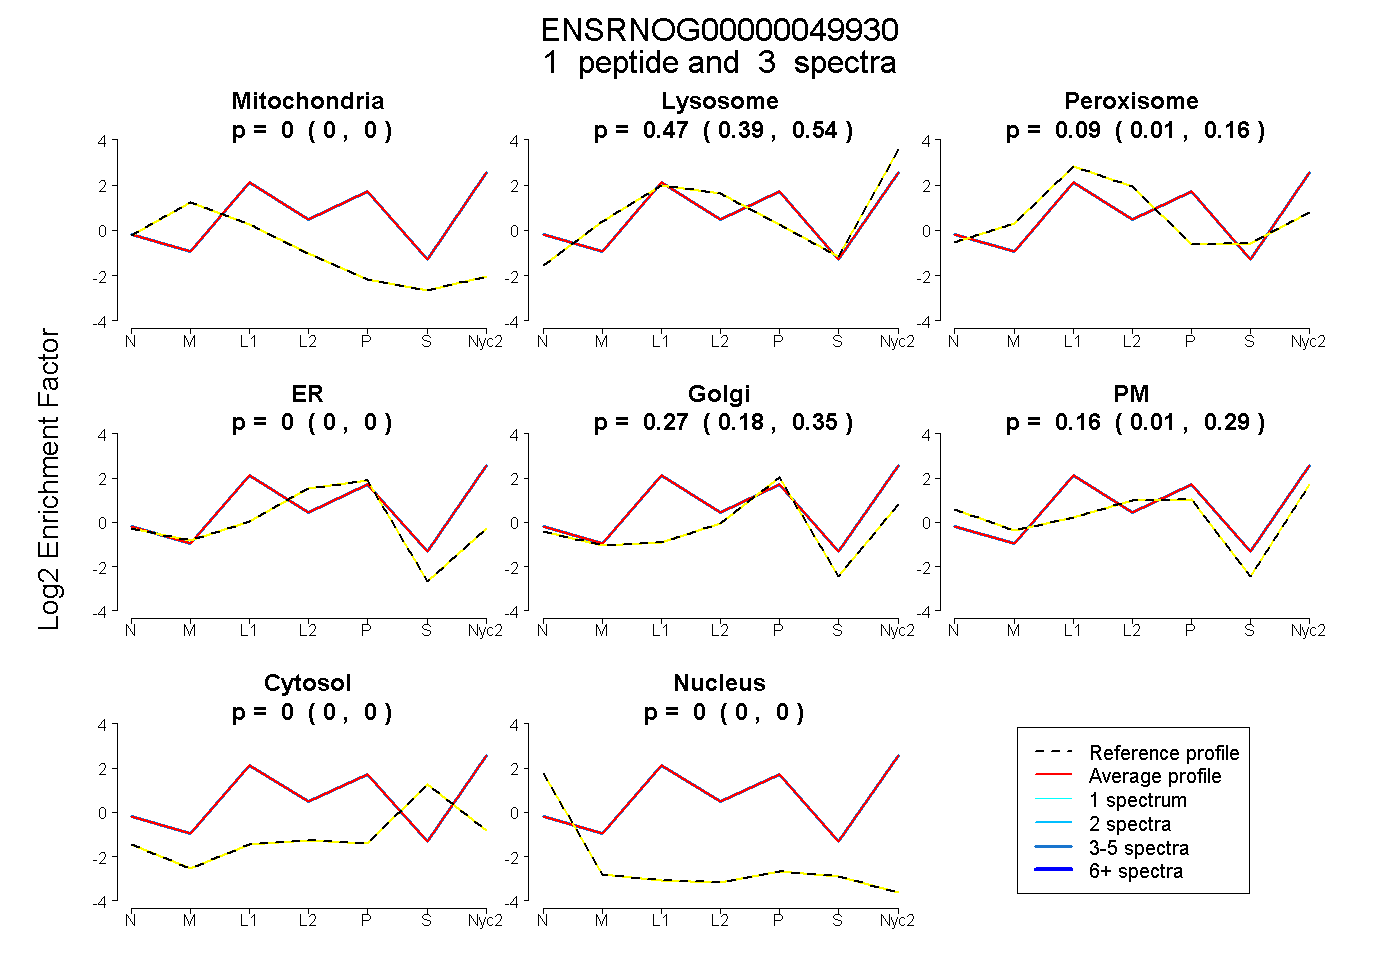
| Plot | Mito | Lyso | Perox | ER | Golgi | PM | Cytosol | Nucleus | |||||
| Expt A |
1 peptide |
3 spectra |
|
0.000 0.000 | 0.000 |
0.474 0.392 | 0.541 |
0.092 0.010 | 0.157 |
0.000 0.000 | 0.000 |
0.273 0.178 | 0.350 |
0.161 0.013 | 0.287 |
0.000 0.000 | 0.000 |
0.000 0.000 | 0.000 |
||
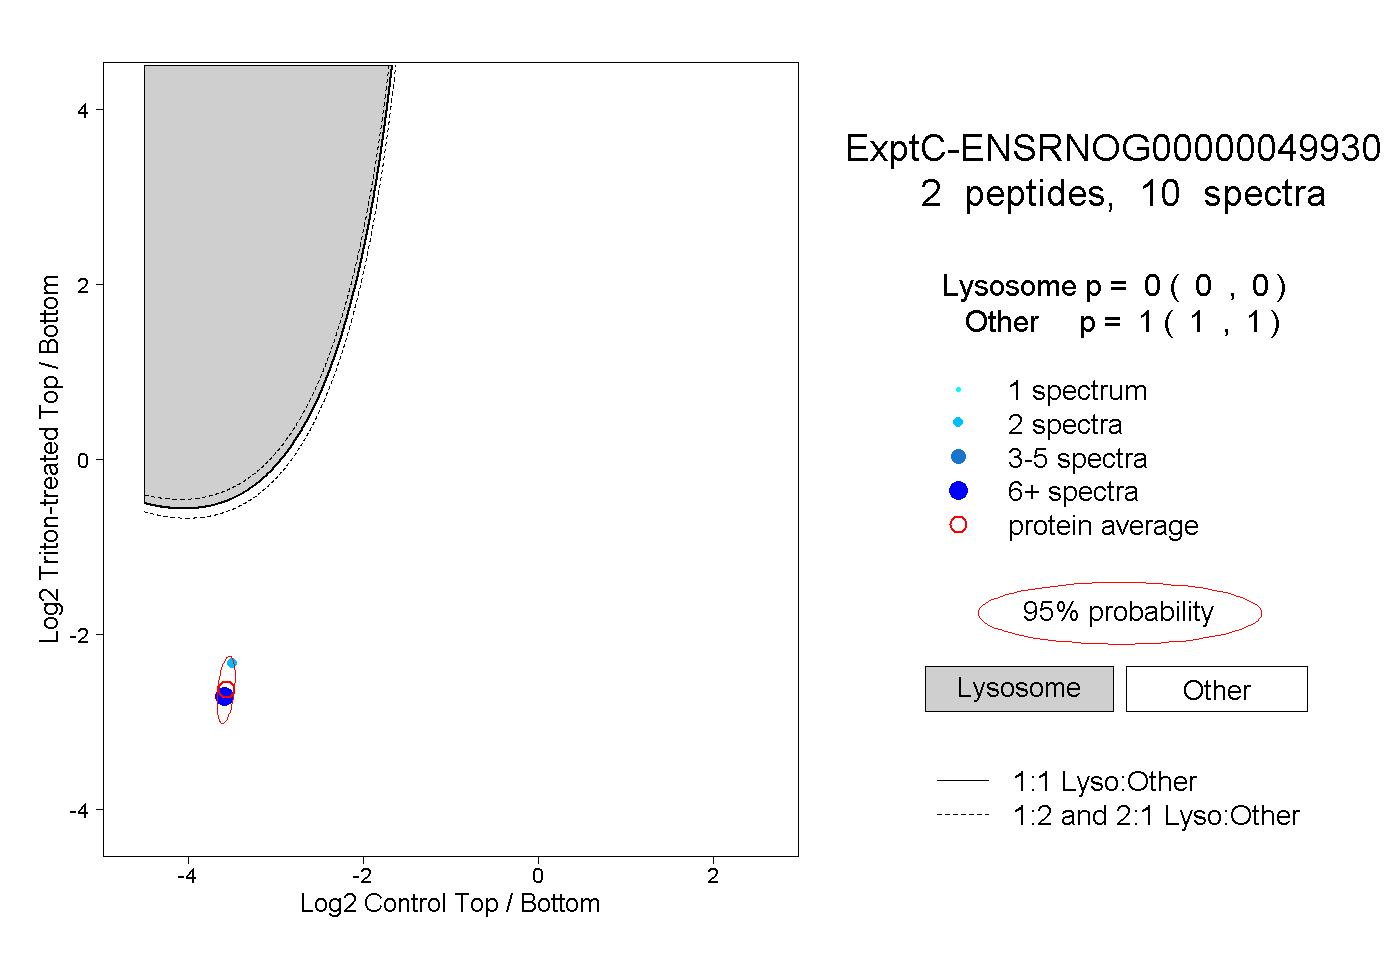
| Plot | Lyso | Other | |||||||||||
| Expt C |
2 peptides |
10 spectra |
|
0.000 0.000 | 0.000 |
1.000 1.000 | 1.000 |