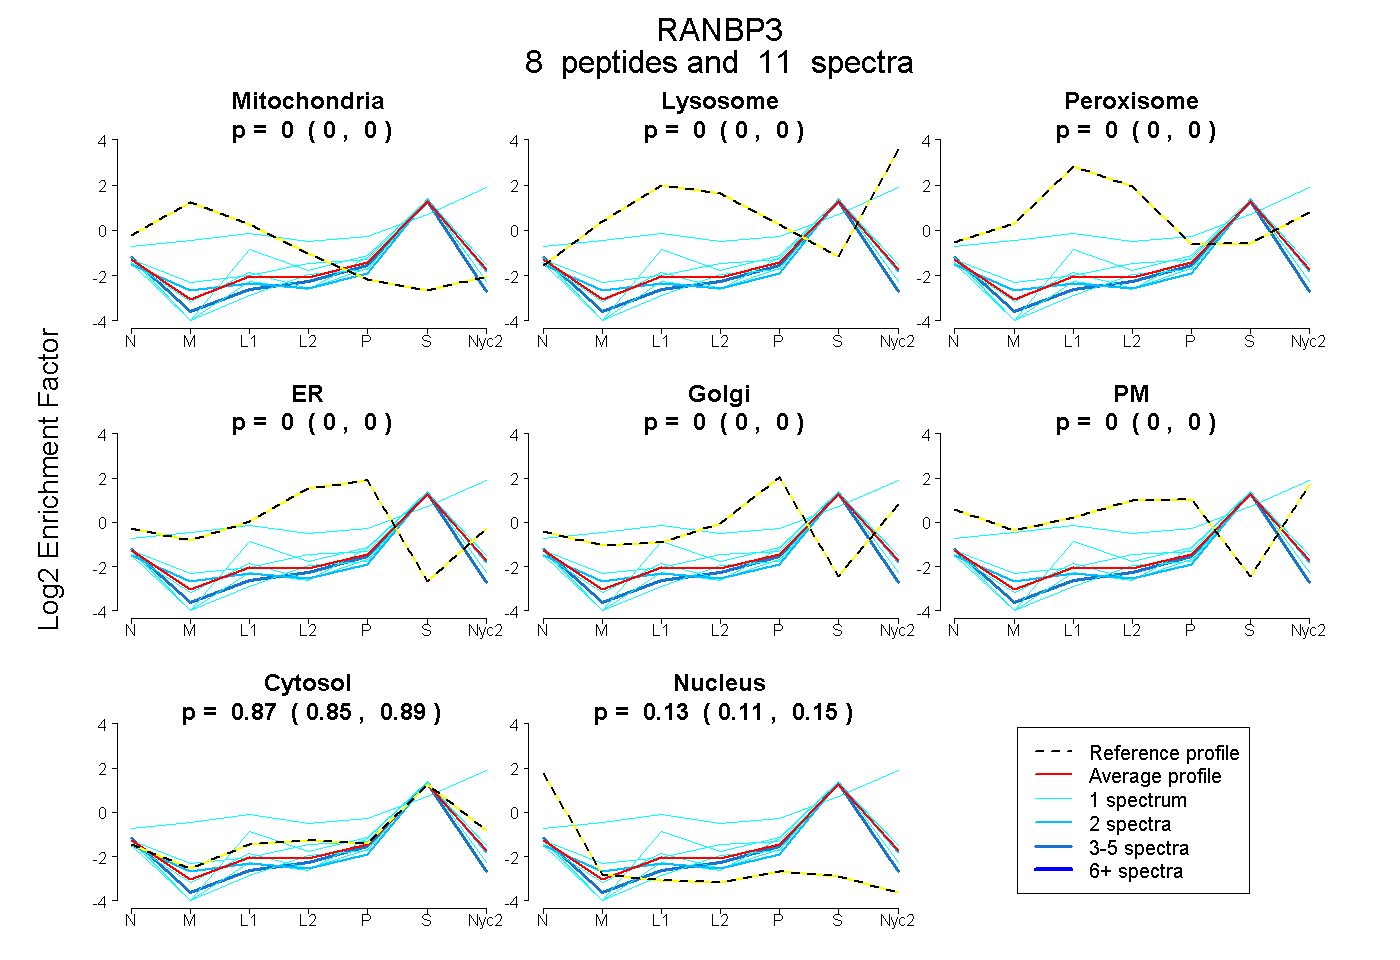
 8
8peptides
spectra
0.000 | 0.000
0.000 | 0.000
0.000 | 0.000
0.000 | 0.000
0.000 | 0.000
0.000 | 0.000
0.847 | 0.888
0.108 | 0.149
| Plot | Mito | Lyso | Perox | ER | Golgi | PM | Cytosol | Nucleus | |||||
| Expt A |
8 peptides |
11 spectra |
|
0.000 0.000 | 0.000 |
0.000 0.000 | 0.000 |
0.000 0.000 | 0.000 |
0.000 0.000 | 0.000 |
0.000 0.000 | 0.000 |
0.000 0.000 | 0.000 |
0.869 0.847 | 0.888 |
0.131 0.108 | 0.149 |
| 1 spectrum, ATAWTCLLEK | 0.000 | 0.000 | 0.000 | 0.000 | 0.000 | 0.000 | 0.884 | 0.116 | ||
| 3 spectra, APPPEPGATR | 0.000 | 0.000 | 0.000 | 0.000 | 0.000 | 0.000 | 0.766 | 0.234 | ||
| 2 spectra, VFLISASSK | 0.000 | 0.000 | 0.000 | 0.000 | 0.000 | 0.000 | 0.844 | 0.156 | ||
| 1 spectrum, LNEANSDTSR | 0.000 | 0.000 | 0.000 | 0.000 | 0.000 | 0.000 | 0.808 | 0.192 | ||
| 1 spectrum, LILNTK | 0.000 | 0.000 | 0.000 | 0.000 | 0.000 | 0.000 | 0.838 | 0.162 | ||
| 1 spectrum, VEVITGEEAESNVLQIQCK | 0.000 | 0.000 | 0.000 | 0.000 | 0.000 | 0.000 | 0.922 | 0.078 | ||
| 1 spectrum, LWAQMQMDK | 0.000 | 0.455 | 0.000 | 0.000 | 0.000 | 0.052 | 0.494 | 0.000 | ||
| 1 spectrum, VLSPPK | 0.000 | 0.000 | 0.000 | 0.000 | 0.000 | 0.000 | 0.922 | 0.078 |
| Plot | Mito | Lyso or Perox | ER | Golgi | PM | Cytosol | Nucleus | ||||||
| Expt B |
1 peptide |
2 spectra |
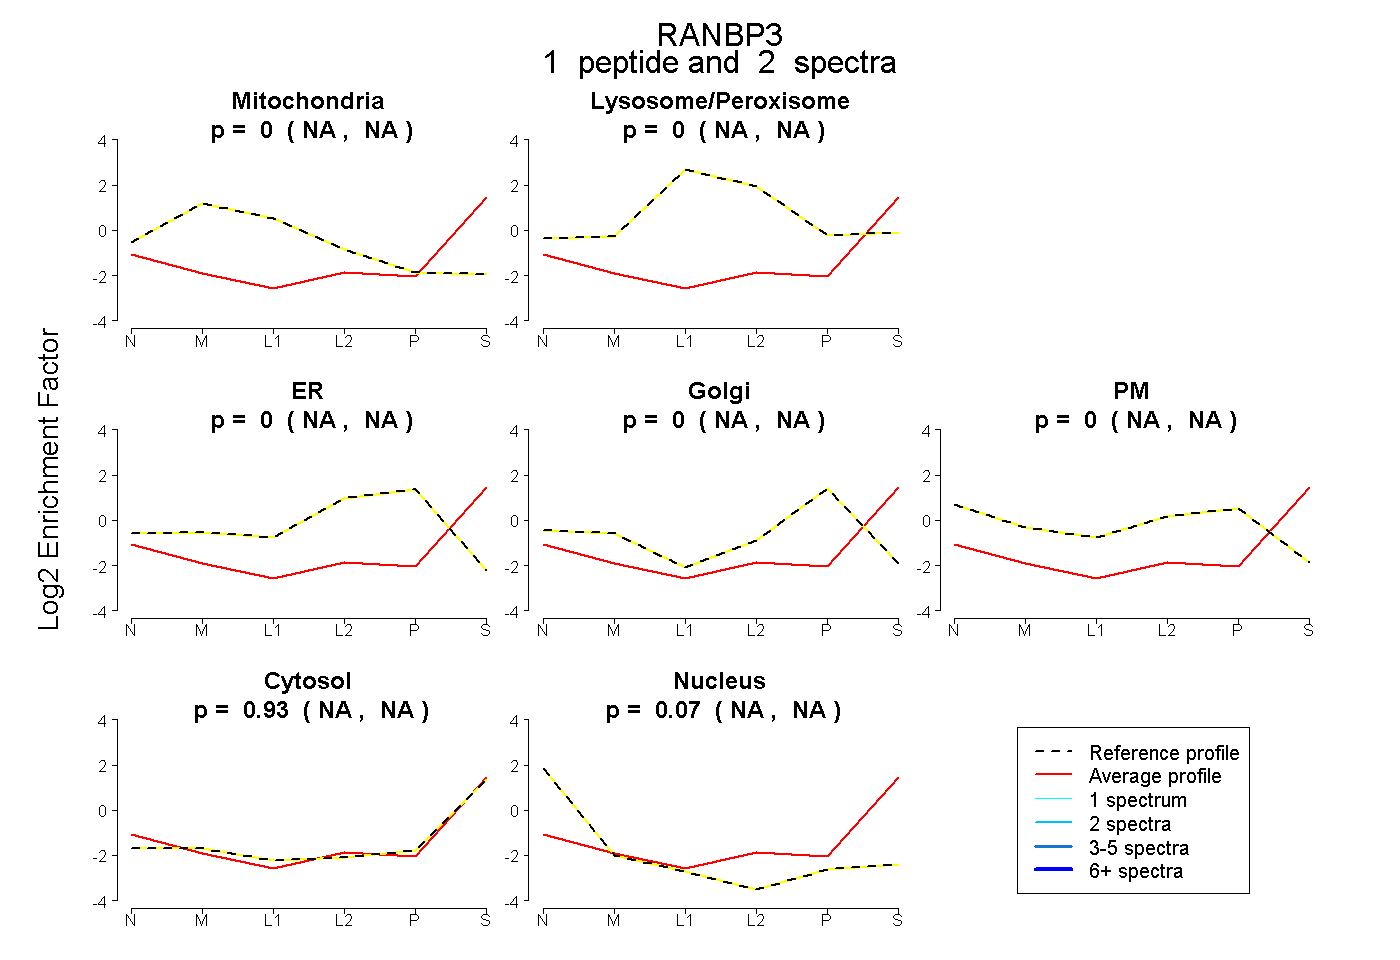 |
0.000 NA | NA |
0.000 NA | NA |
0.000 NA | NA |
0.000 NA | NA |
0.000 NA | NA |
0.927 NA | NA |
0.073 NA | NA |
|||
| Plot | Lyso | Other | |||||||||||
| Expt C |
2 peptides |
3 spectra |
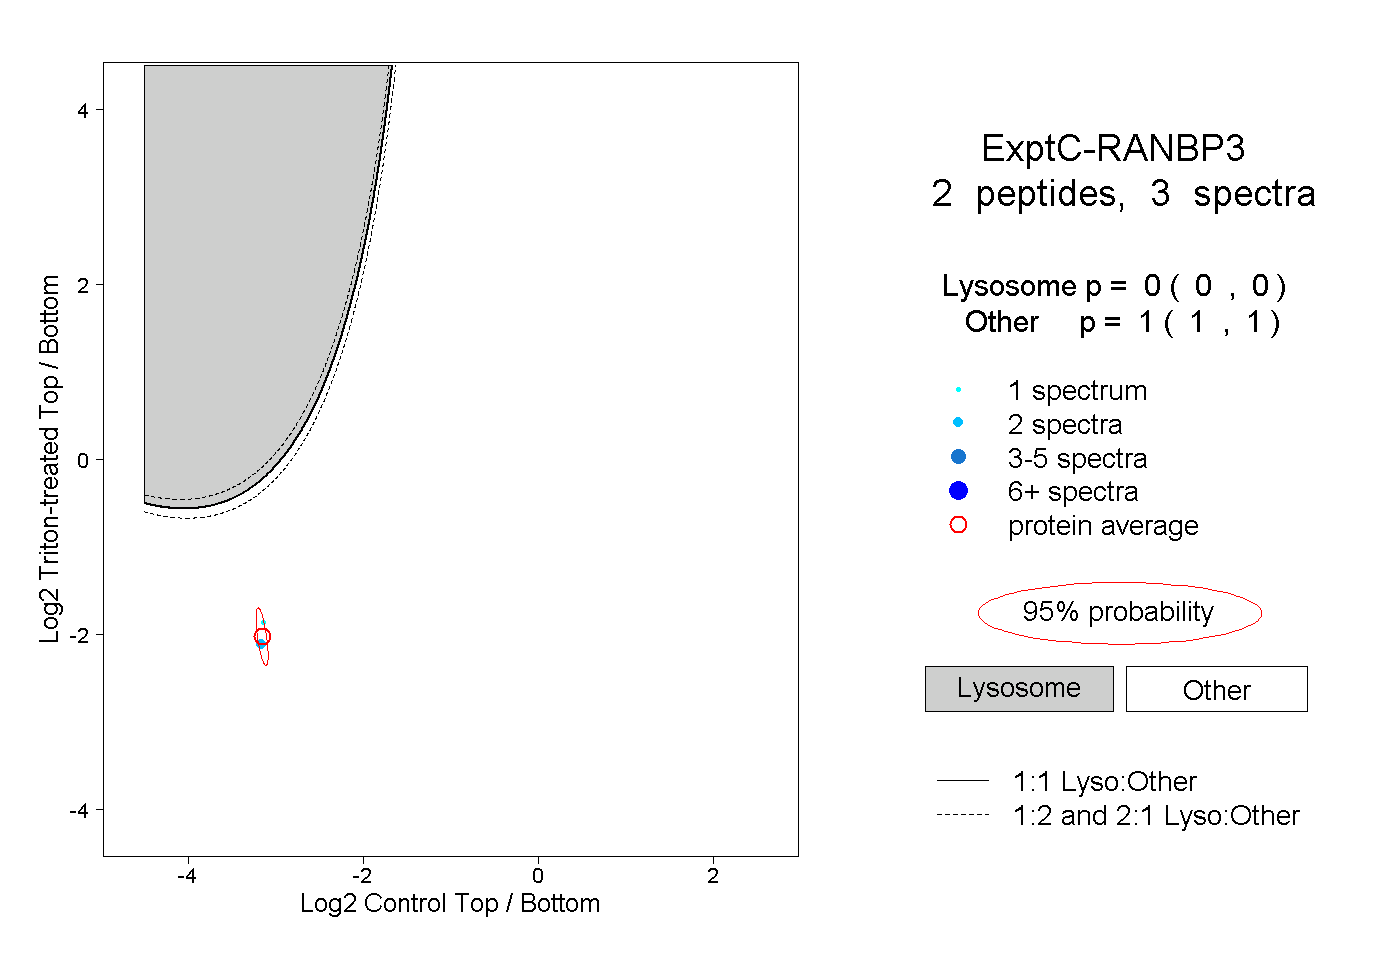 |
0.000 0.000 | 0.000 |
1.000 1.000 | 1.000 |