 5
5peptides
spectra
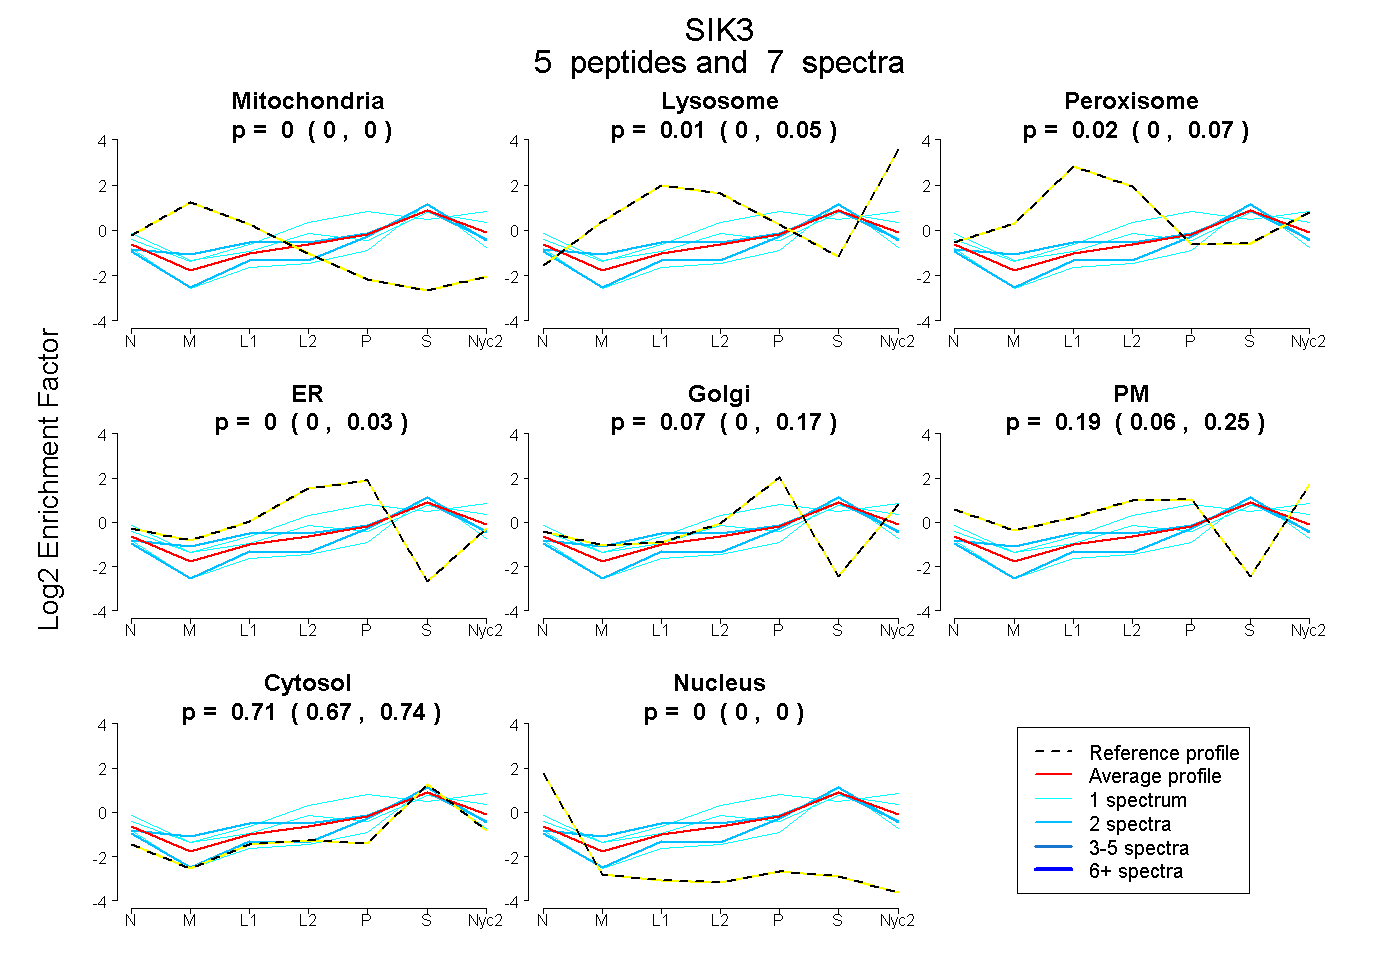
0.000 | 0.000
0.000 | 0.053
0.000 | 0.071
0.000 | 0.030
0.000 | 0.168
0.058 | 0.251
0.671 | 0.737
0.000 | 0.000
| Plot | Mito | Lyso | Perox | ER | Golgi | PM | Cytosol | Nucleus | |||||
| Expt A |
5 peptides |
7 spectra |
|
0.000 0.000 | 0.000 |
0.009 0.000 | 0.053 |
0.023 0.000 | 0.071 |
0.000 0.000 | 0.030 |
0.070 0.000 | 0.168 |
0.187 0.058 | 0.251 |
0.710 0.671 | 0.737 |
0.000 0.000 | 0.000 |
| 1 spectrum, AQDCISQGPLPTPTR | 0.000 | 0.167 | 0.000 | 0.024 | 0.179 | 0.184 | 0.447 | 0.000 | ||
| 1 spectrum, IGYYEIDR | 0.000 | 0.000 | 0.000 | 0.000 | 0.066 | 0.000 | 0.895 | 0.039 | ||
| 2 spectra, LYQVMETER | 0.000 | 0.000 | 0.215 | 0.000 | 0.169 | 0.000 | 0.616 | 0.000 | ||
| 1 spectrum, EYDGPK | 0.000 | 0.014 | 0.059 | 0.000 | 0.000 | 0.306 | 0.621 | 0.000 | ||
| 2 spectra, LGDADPNFER | 0.000 | 0.000 | 0.000 | 0.000 | 0.164 | 0.000 | 0.836 | 0.000 |
| Plot | Lyso | Other | |||||||||||
| Expt C |
3 peptides |
6 spectra |
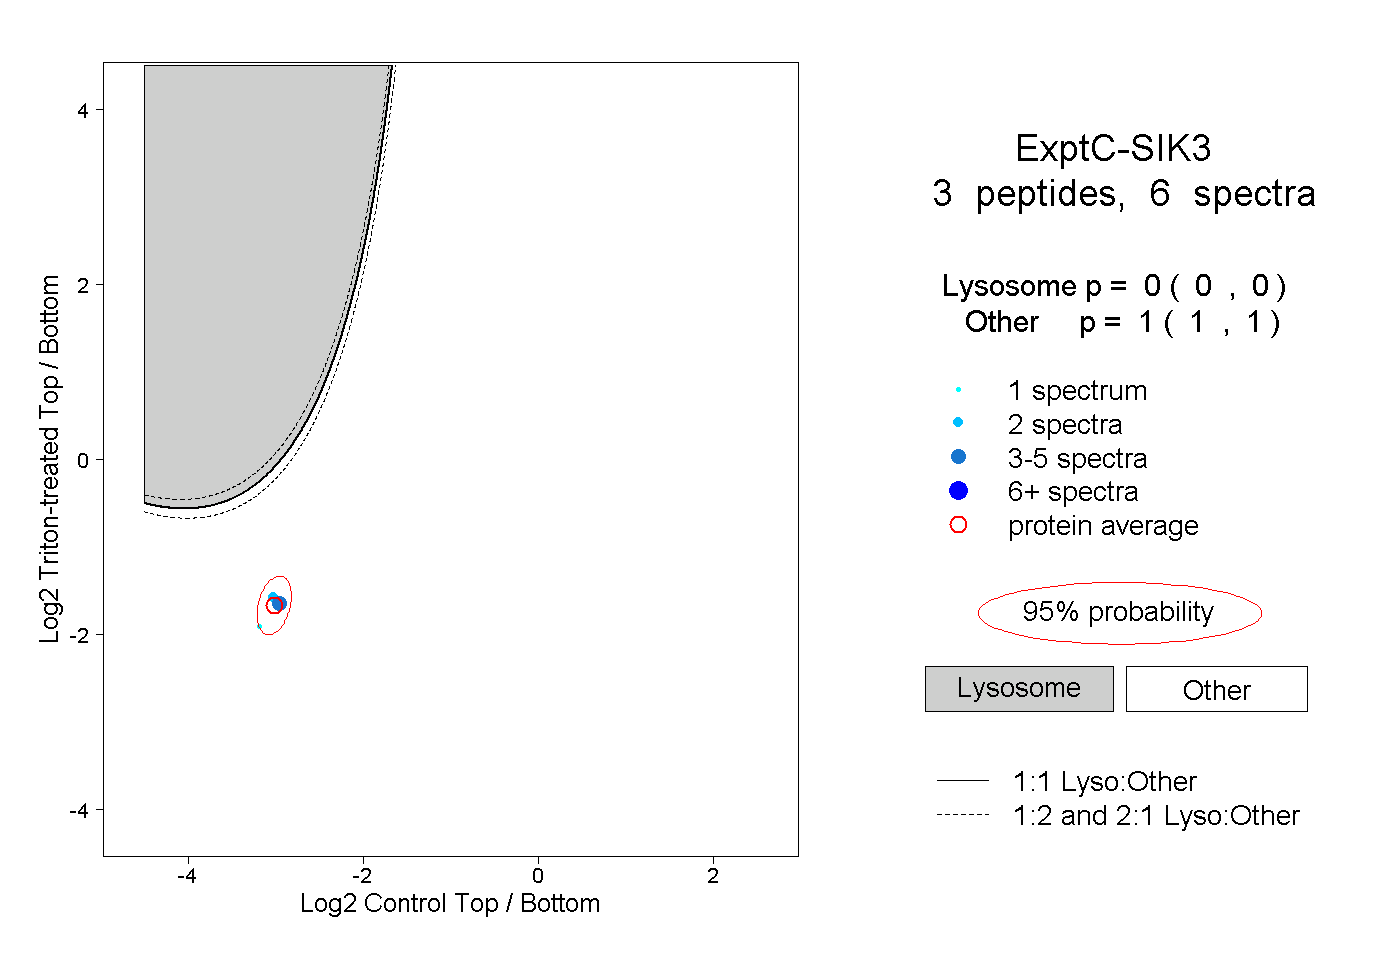 |
0.000 0.000 | 0.000 |
1.000 1.000 | 1.000 |