15
15peptides
spectra
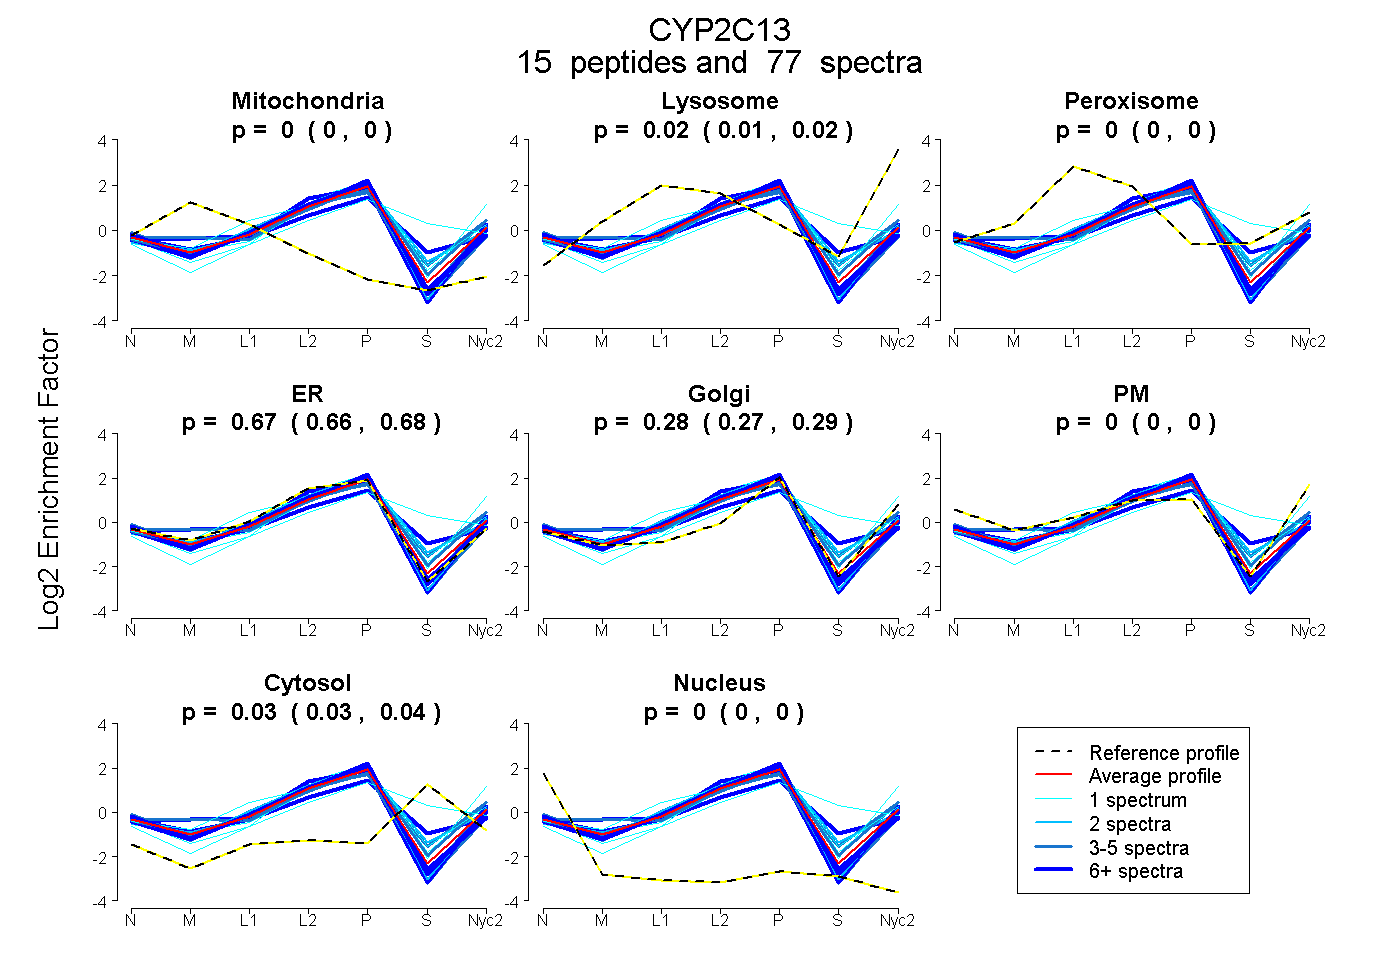
0.000 | 0.000
0.015 | 0.022
0.000 | 0.000
0.663 | 0.677
0.267 | 0.285
0.000 | 0.000
0.027 | 0.039
0.000 | 0.000
7peptides
spectra
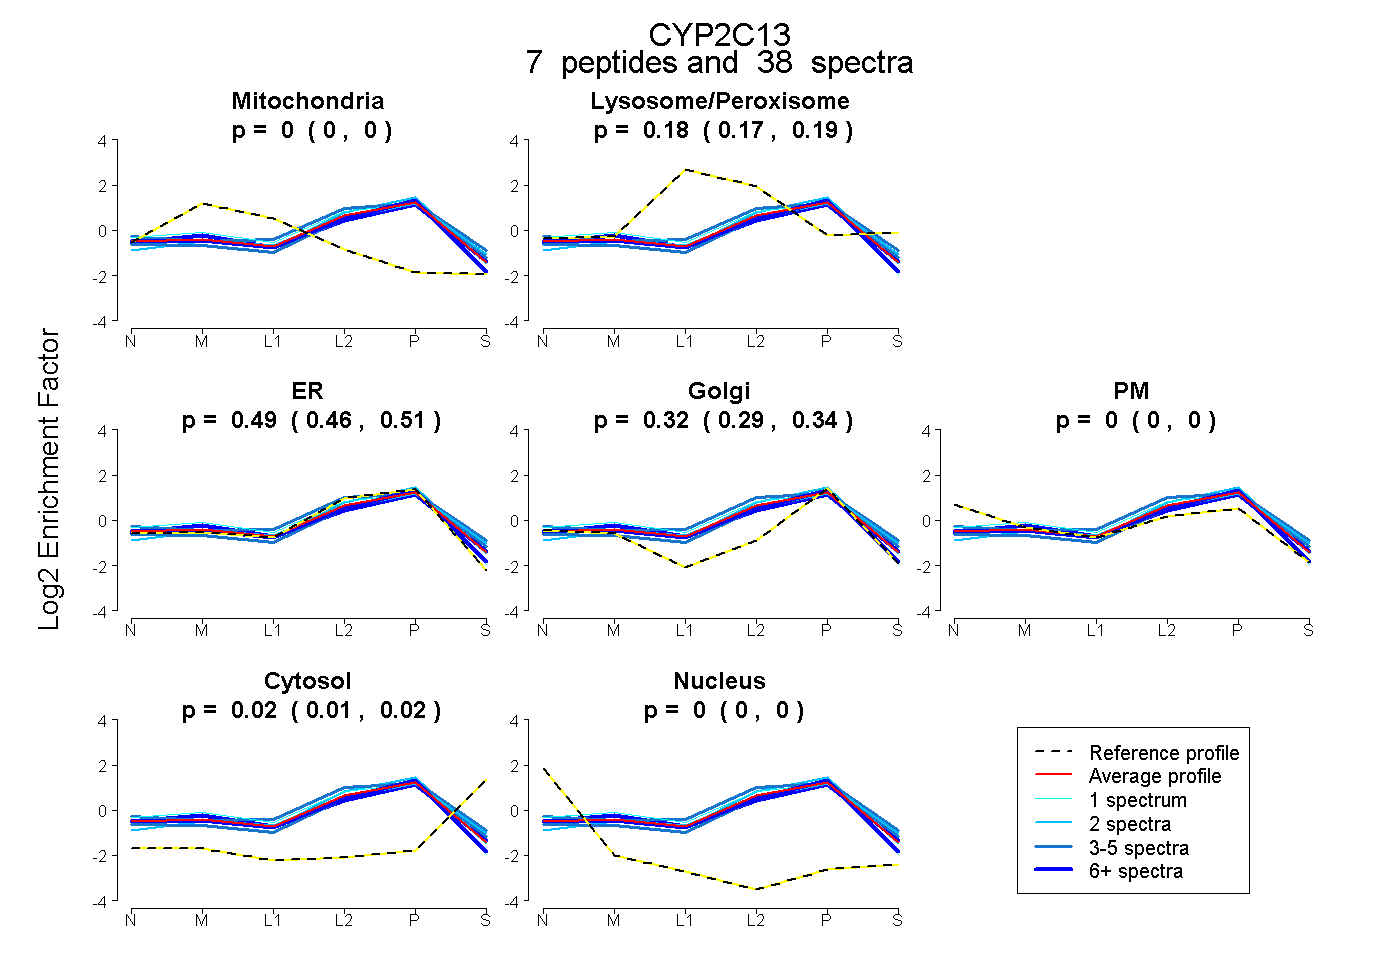
0.000 | 0.000
0.166 | 0.185
0.461 | 0.514
0.293 | 0.337
0.000 | 0.000
0.009 | 0.023
0.000 | 0.000