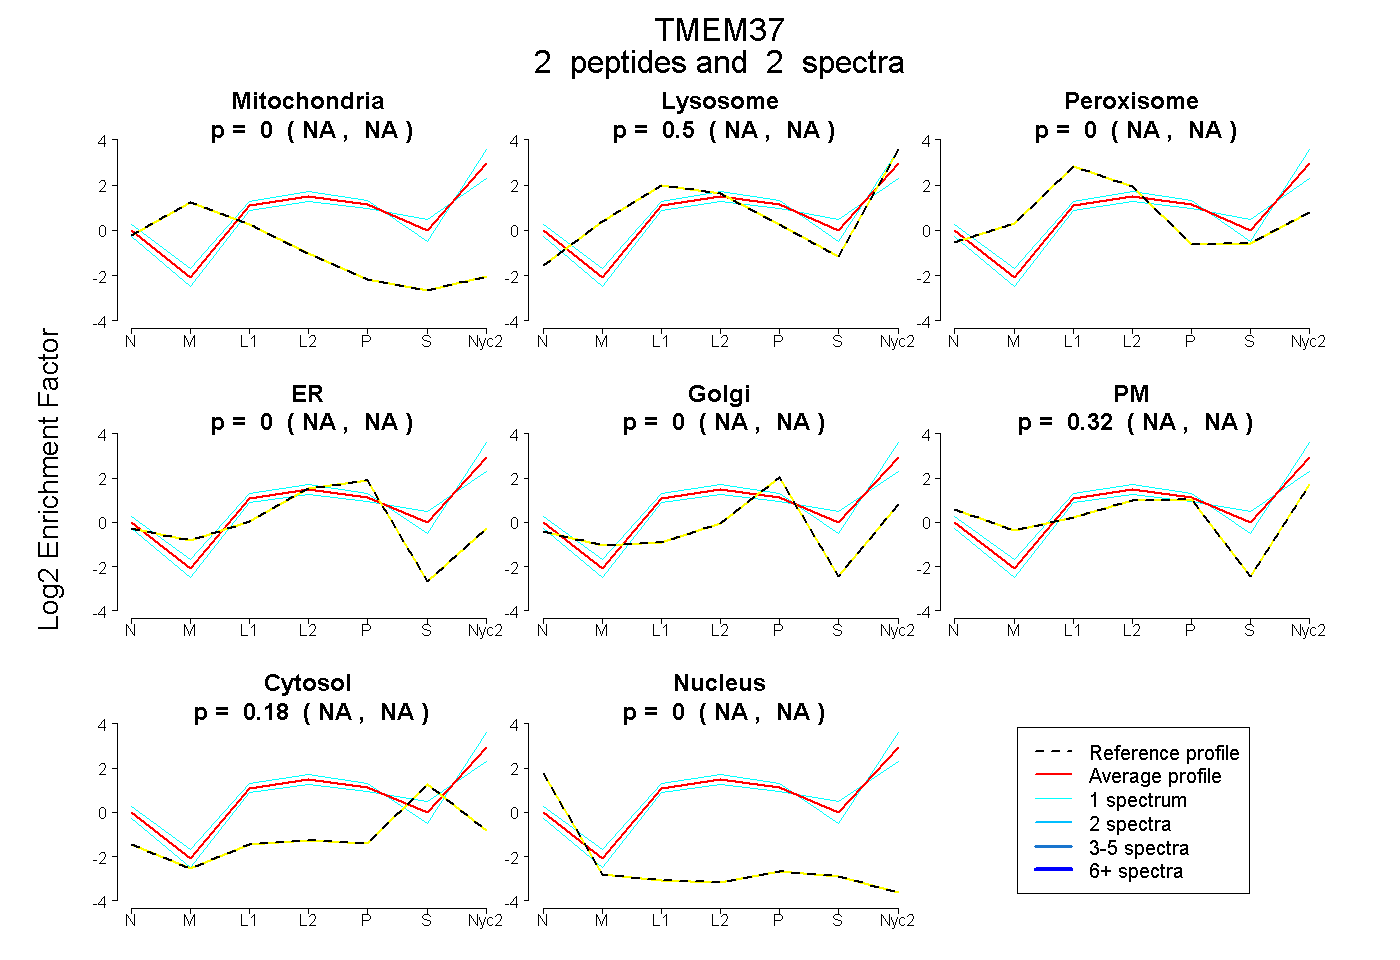
 2
2peptides
spectra
NA | NA
NA | NA
NA | NA
NA | NA
NA | NA
NA | NA
NA | NA
NA | NA
| Plot | Mito | Lyso | Perox | ER | Golgi | PM | Cytosol | Nucleus | |||||
| Expt A |
2 peptides |
2 spectra |
|
0.000 NA | NA |
0.500 NA | NA |
0.000 NA | NA |
0.000 NA | NA |
0.000 NA | NA |
0.317 NA | NA |
0.183 NA | NA |
0.000 NA | NA |
| 1 spectrum, SFFESFIR | 0.000 | 0.544 | 0.000 | 0.000 | 0.000 | 0.417 | 0.039 | 0.000 | ||
| 1 spectrum, SPPAGTLAYR | 0.000 | 0.456 | 0.000 | 0.000 | 0.000 | 0.217 | 0.327 | 0.000 |
| Plot | Lyso | Other | |||||||||||
| Expt C |
2 peptides |
9 spectra |
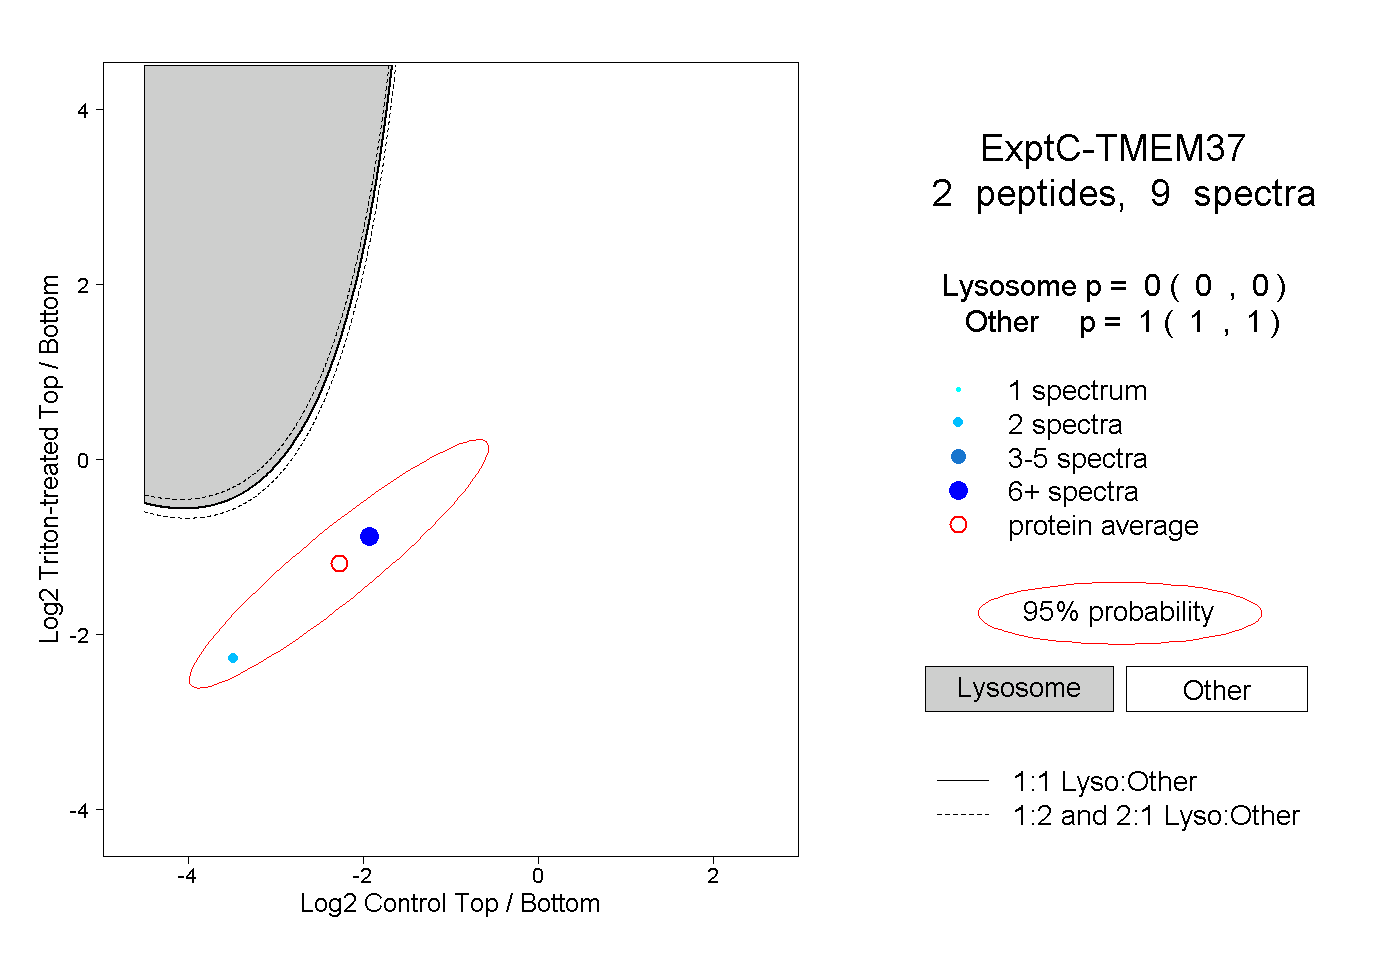 |
0.000 0.000 | 0.000 |
1.000 1.000 | 1.000 |