 3
3peptides
spectra
0.240 | 0.621
0.000 | 0.171
0.000 | 0.310
0.000 | 0.270
0.000 | 0.068
0.000 | 0.192
0.000 | 0.332
0.000 | 0.156
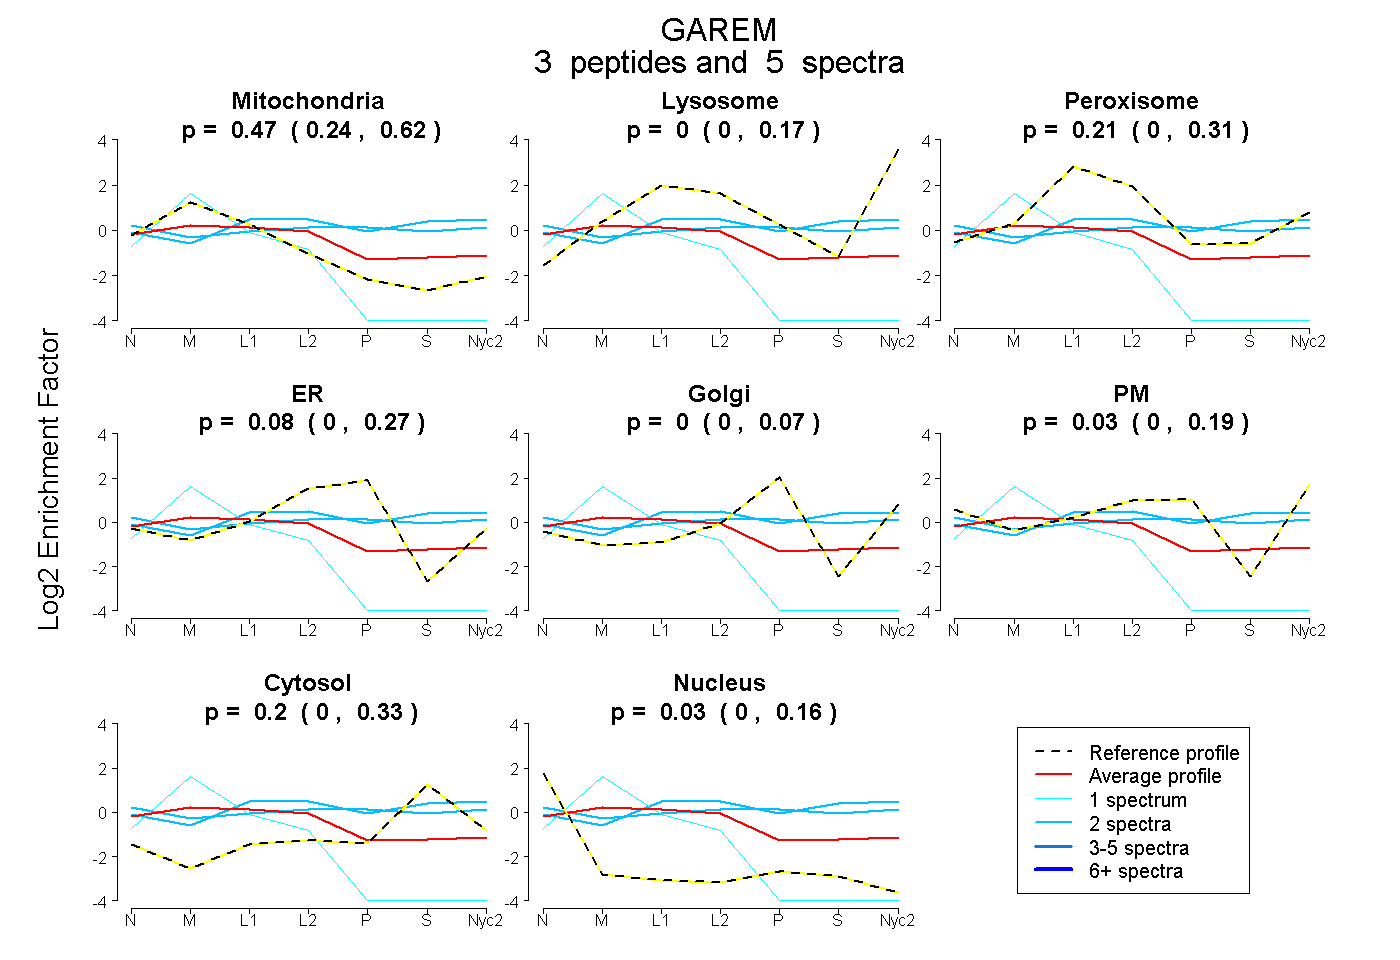
| Plot | Mito | Lyso | Perox | ER | Golgi | PM | Cytosol | Nucleus | |||||
| Expt A |
3 peptides |
5 spectra |
|
0.467 0.240 | 0.621 |
0.000 0.000 | 0.171 |
0.206 0.000 | 0.310 |
0.079 0.000 | 0.270 |
0.000 0.000 | 0.068 |
0.026 0.000 | 0.192 |
0.196 0.000 | 0.332 |
0.026 0.000 | 0.156 |
| 1 spectrum, STCATSSPAPATLGATMK | 0.931 | 0.000 | 0.000 | 0.000 | 0.000 | 0.000 | 0.000 | 0.069 | ||
| 2 spectra, SPLELQMQEGEHTIR | 0.058 | 0.000 | 0.192 | 0.000 | 0.000 | 0.389 | 0.361 | 0.000 | ||
| 2 spectra, NPYDLHFIR | 0.000 | 0.000 | 0.380 | 0.000 | 0.000 | 0.245 | 0.376 | 0.000 |