9
9peptides
spectra
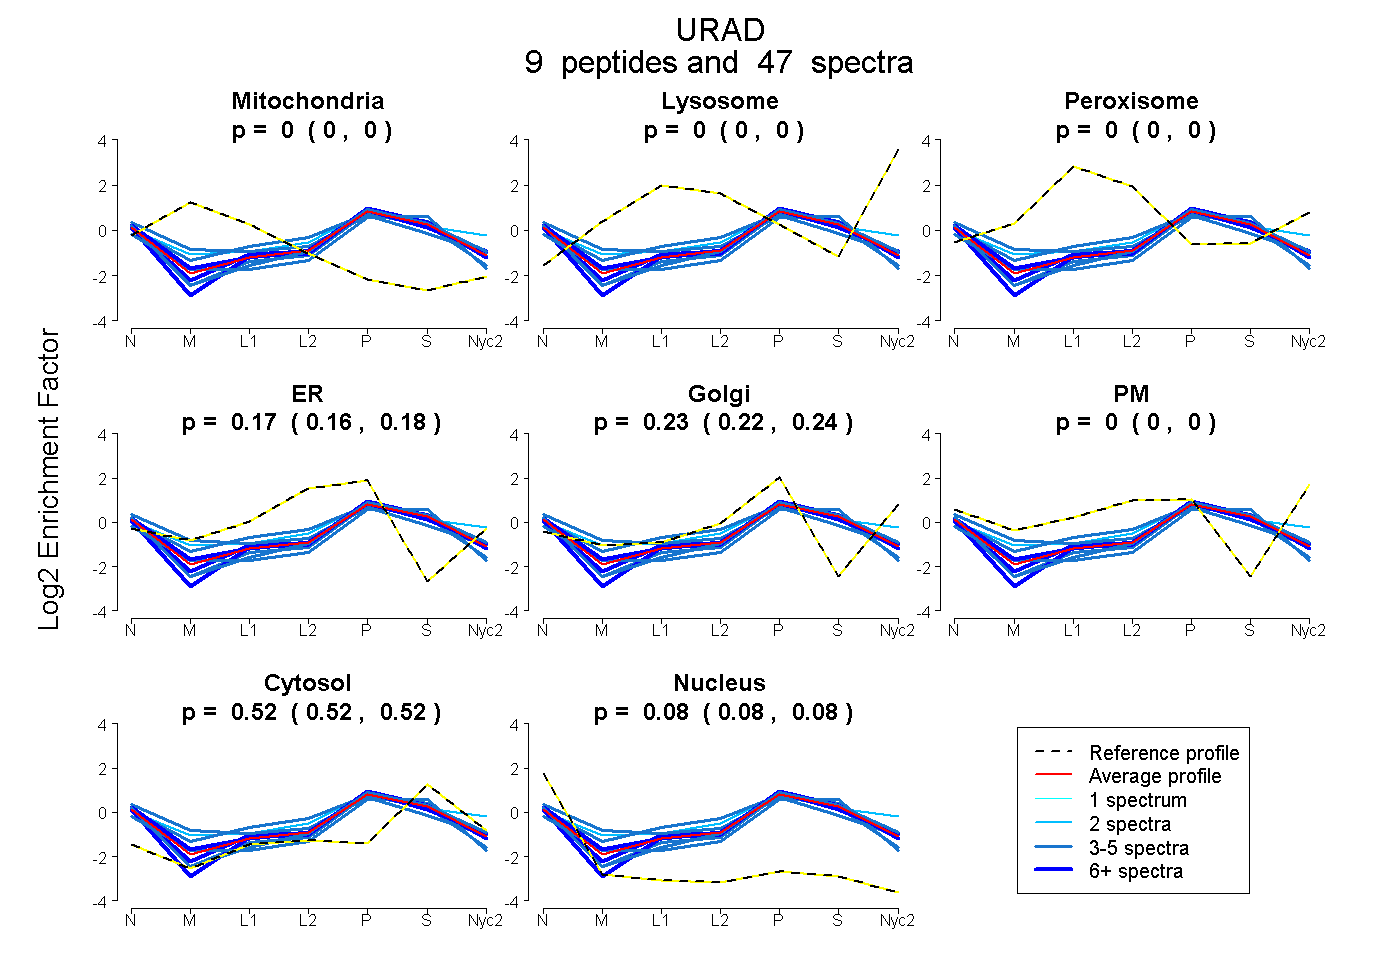
0.000 | 0.000
0.000 | 0.000
0.000 | 0.000
0.155 | 0.177
0.220 | 0.243
0.000 | 0.000
0.517 | 0.524
0.076 | 0.081
5peptides
spectra
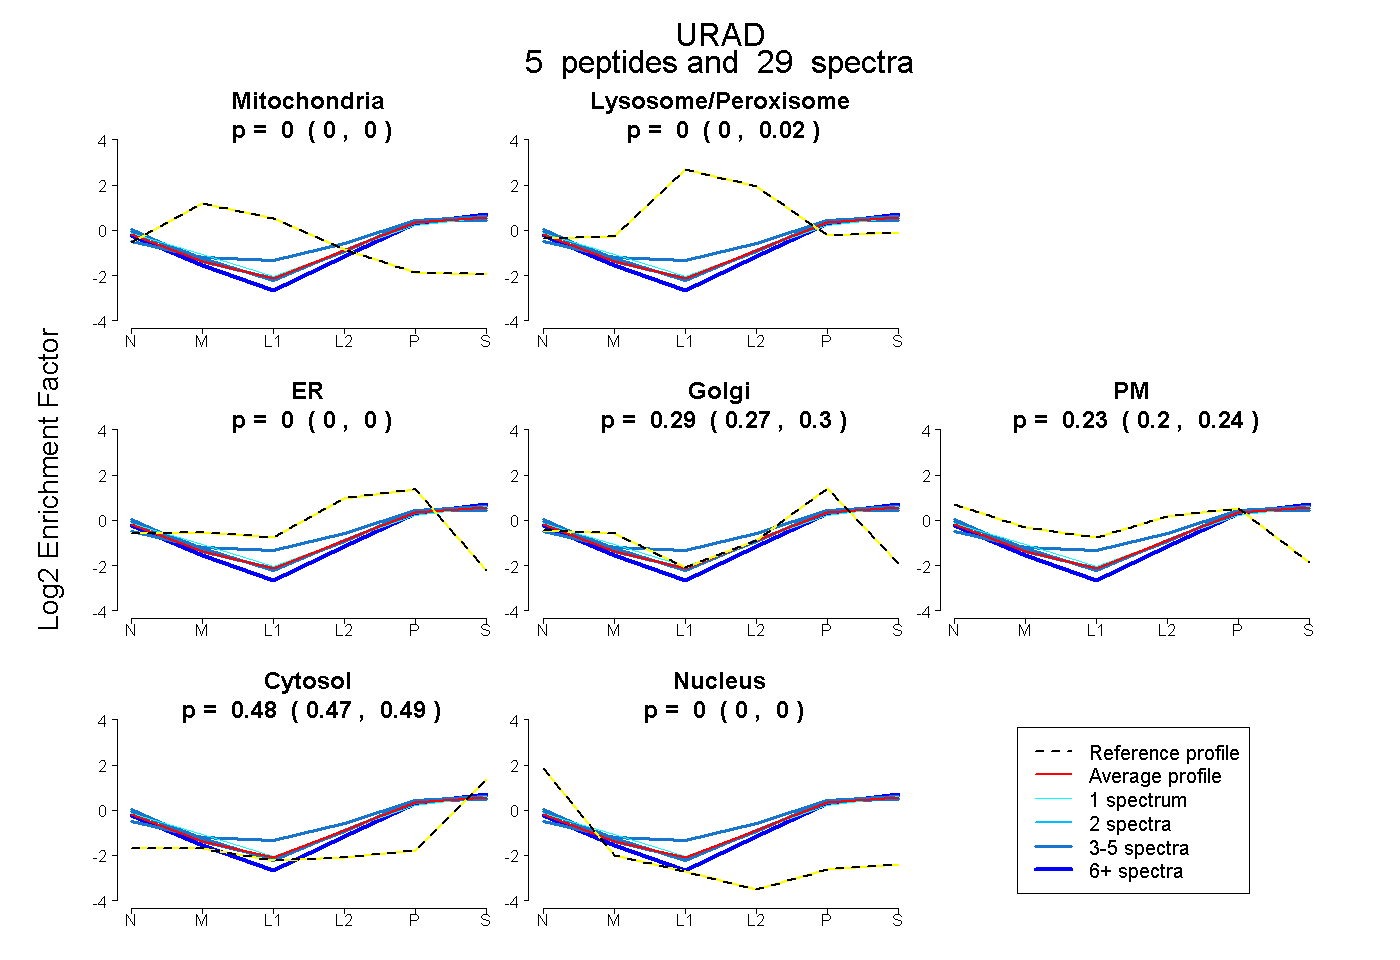
0.000 | 0.000
0.000 | 0.021
0.000 | 0.000
0.271 | 0.303
0.200 | 0.241
0.475 | 0.486
0.000 | 0.000