 9
9peptides
spectra
0.000 | 0.000
0.000 | 0.000
0.000 | 0.000
0.155 | 0.177
0.220 | 0.243
0.000 | 0.000
0.517 | 0.524
0.076 | 0.081
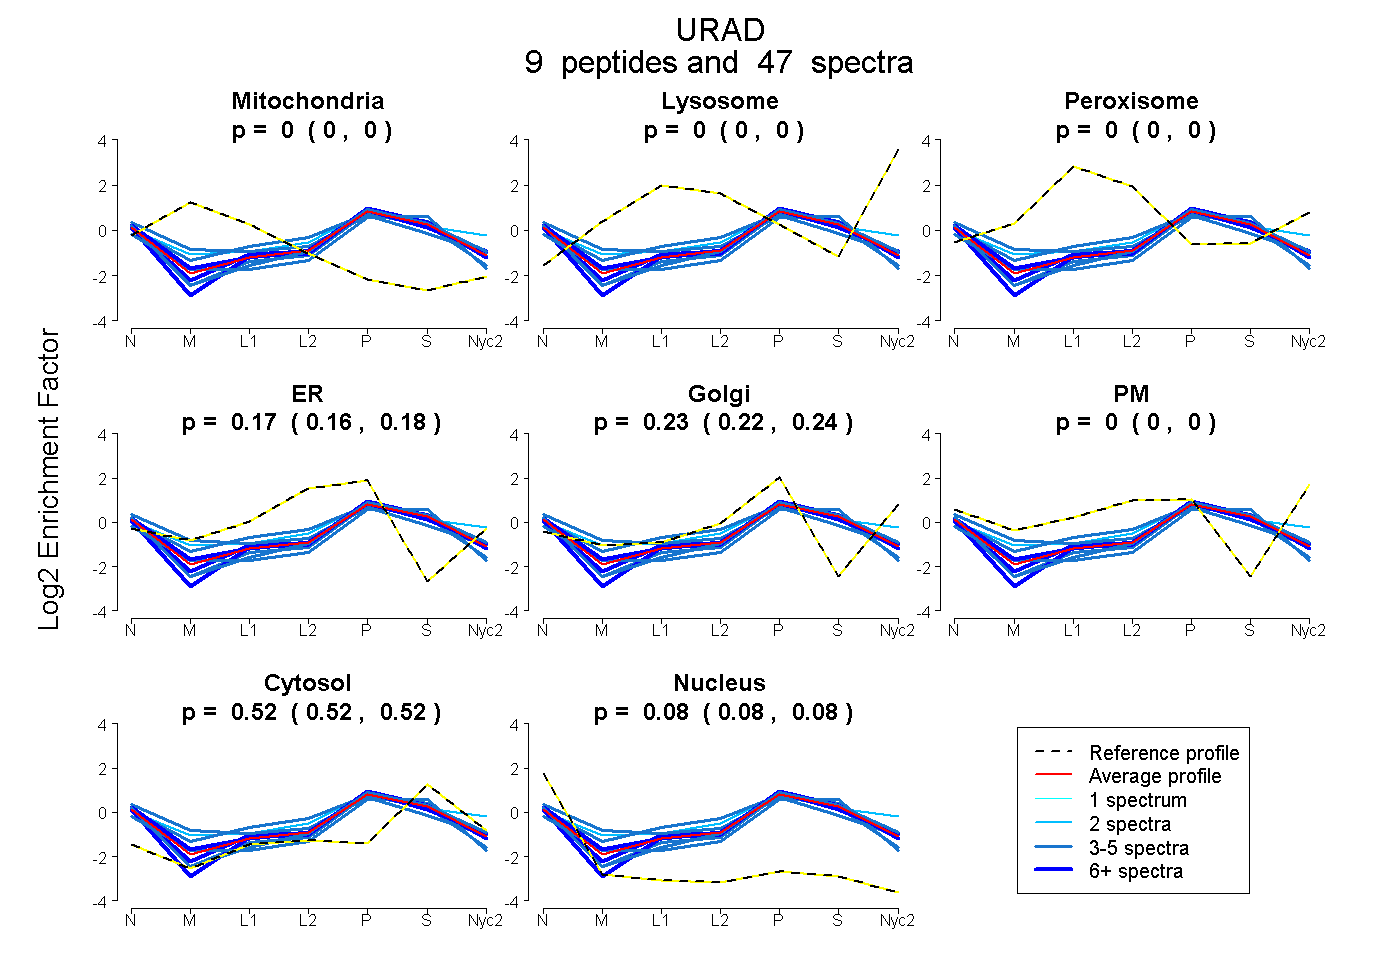
| Plot | Mito | Lyso | Perox | ER | Golgi | PM | Cytosol | Nucleus | |||||
| Expt A |
9 peptides |
47 spectra |
|
0.000 0.000 | 0.000 |
0.000 0.000 | 0.000 |
0.000 0.000 | 0.000 |
0.168 0.155 | 0.177 |
0.233 0.220 | 0.243 |
0.000 0.000 | 0.000 |
0.521 0.517 | 0.524 |
0.079 0.076 | 0.081 |
| 3 spectra, LLHLNQEYR | 0.000 | 0.000 | 0.000 | 0.077 | 0.197 | 0.000 | 0.599 | 0.126 | ||
| 6 spectra, SGQEGILR | 0.000 | 0.000 | 0.000 | 0.134 | 0.306 | 0.000 | 0.484 | 0.076 | ||
| 3 spectra, EQSHAGLTSLK | 0.078 | 0.000 | 0.017 | 0.203 | 0.235 | 0.005 | 0.390 | 0.073 | ||
| 3 spectra, LHCQPESELR | 0.000 | 0.000 | 0.000 | 0.442 | 0.000 | 0.000 | 0.500 | 0.058 | ||
| 8 spectra, DVLMGR | 0.000 | 0.000 | 0.000 | 0.124 | 0.286 | 0.000 | 0.525 | 0.065 | ||
| 3 spectra, VNSLDFTEFVSVFR | 0.000 | 0.000 | 0.000 | 0.011 | 0.378 | 0.000 | 0.523 | 0.088 | ||
| 2 spectra, CHPDLAGR | 0.000 | 0.000 | 0.009 | 0.052 | 0.291 | 0.168 | 0.480 | 0.000 | ||
| 5 spectra, ATVFQELAR | 0.000 | 0.000 | 0.000 | 0.047 | 0.303 | 0.000 | 0.555 | 0.095 | ||
| 14 spectra, LIDLLDSHYFGVEPPQGR | 0.000 | 0.000 | 0.000 | 0.120 | 0.234 | 0.000 | 0.559 | 0.087 |
| Plot | Mito | Lyso or Perox | ER | Golgi | PM | Cytosol | Nucleus | ||||||
| Expt B |
5 peptides |
29 spectra |
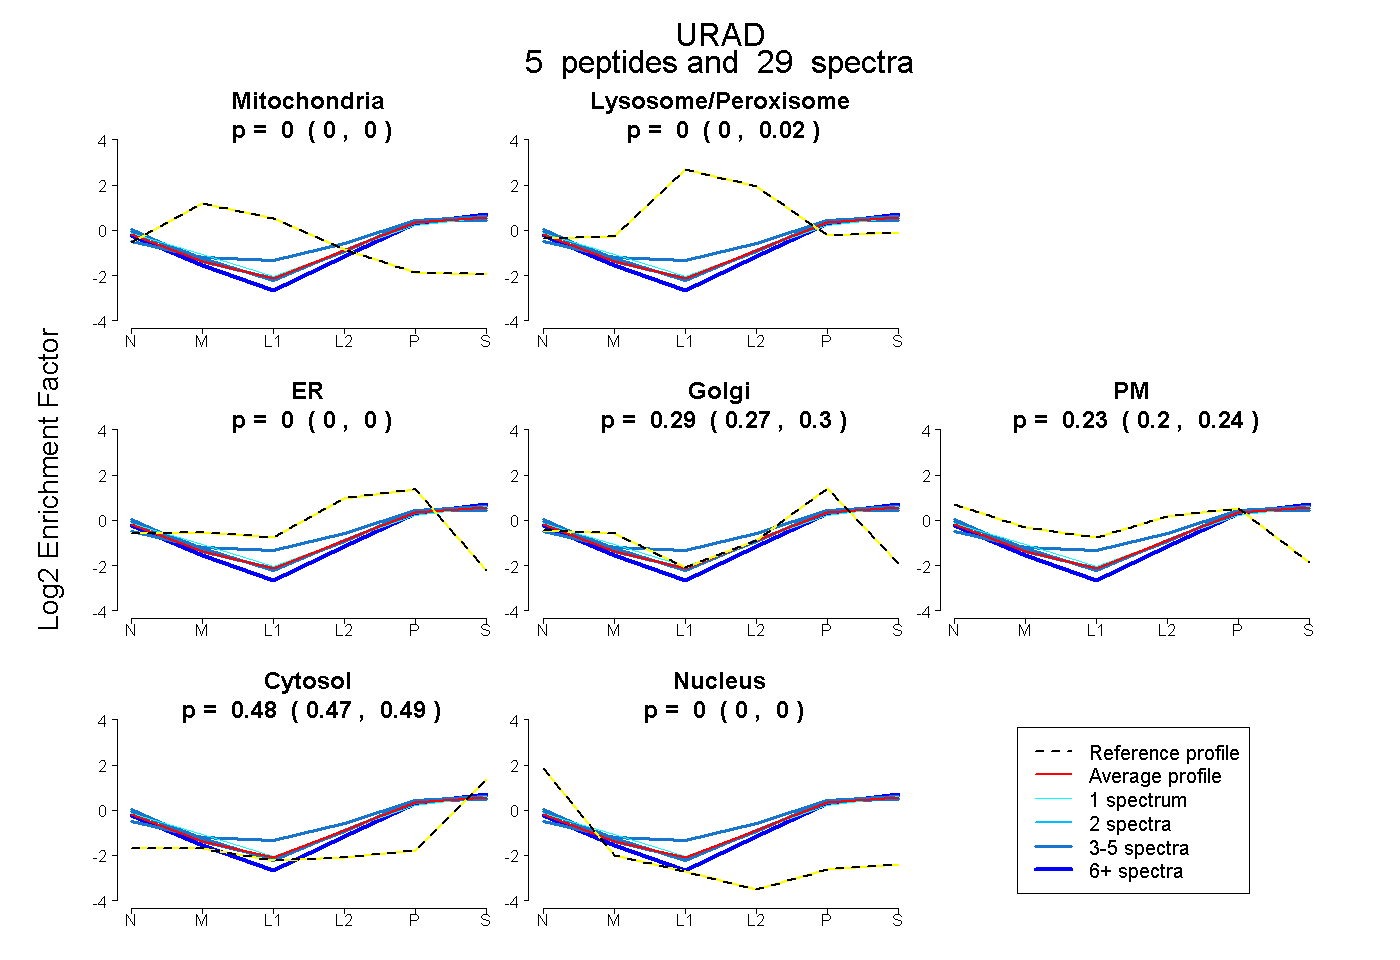 |
0.000 0.000 | 0.000 |
0.004 0.000 | 0.021 |
0.000 0.000 | 0.000 |
0.285 0.271 | 0.303 |
0.228 0.200 | 0.241 |
0.482 0.475 | 0.486 |
0.000 0.000 | 0.000 |
|||
| Plot | Lyso | Other | |||||||||||
| Expt C |
8 peptides |
43 spectra |
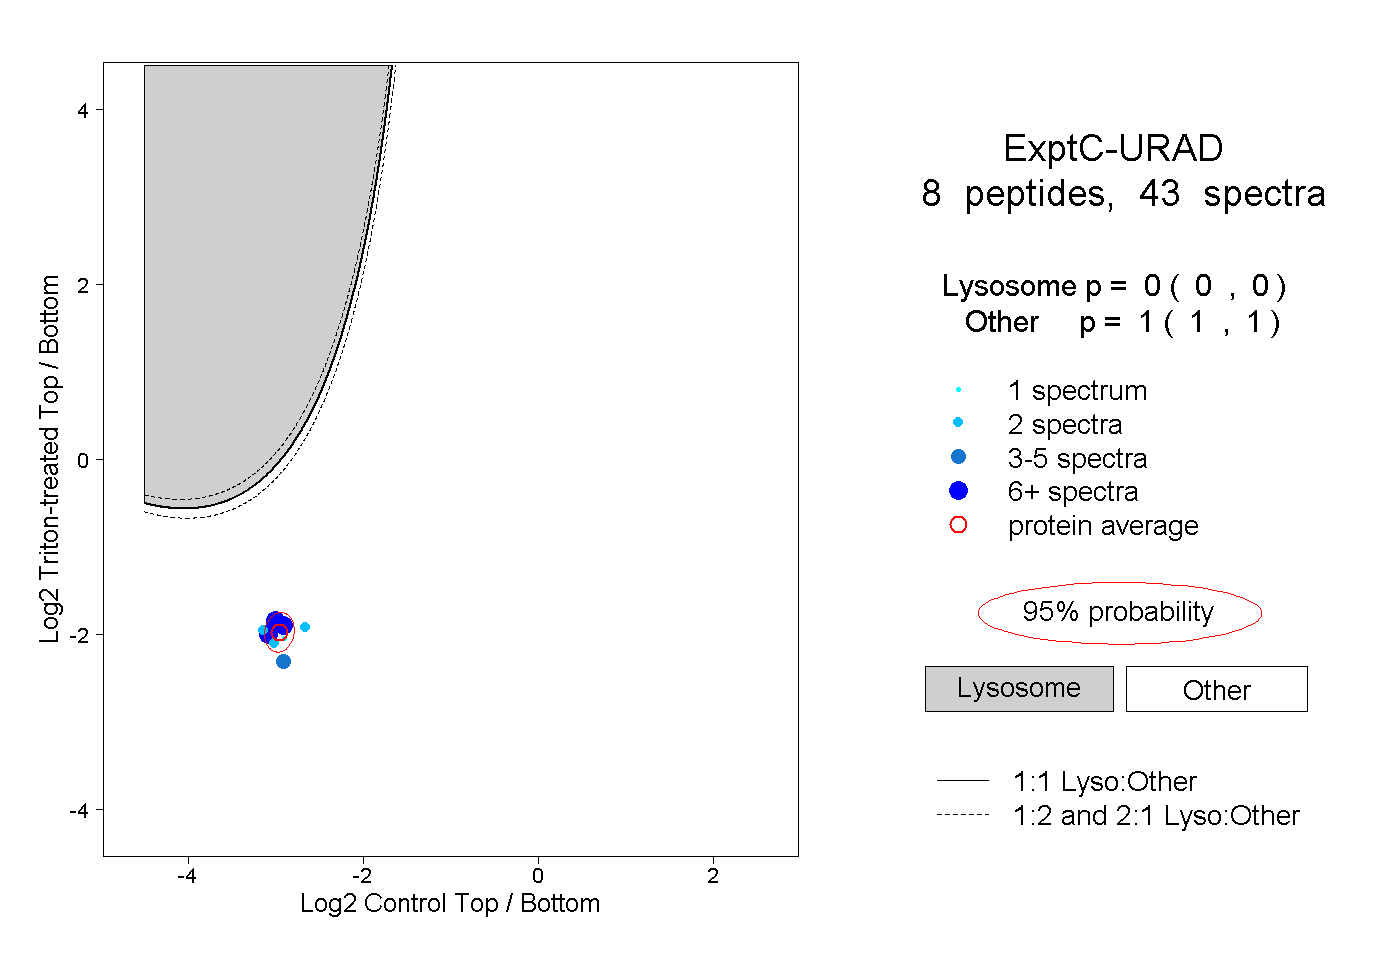 |
0.000 0.000 | 0.000 |
1.000 1.000 | 1.000 |
||||||||
| Plot | Lyso | Other | |||||||||||
| Expt D |
2 peptides |
4 spectra |
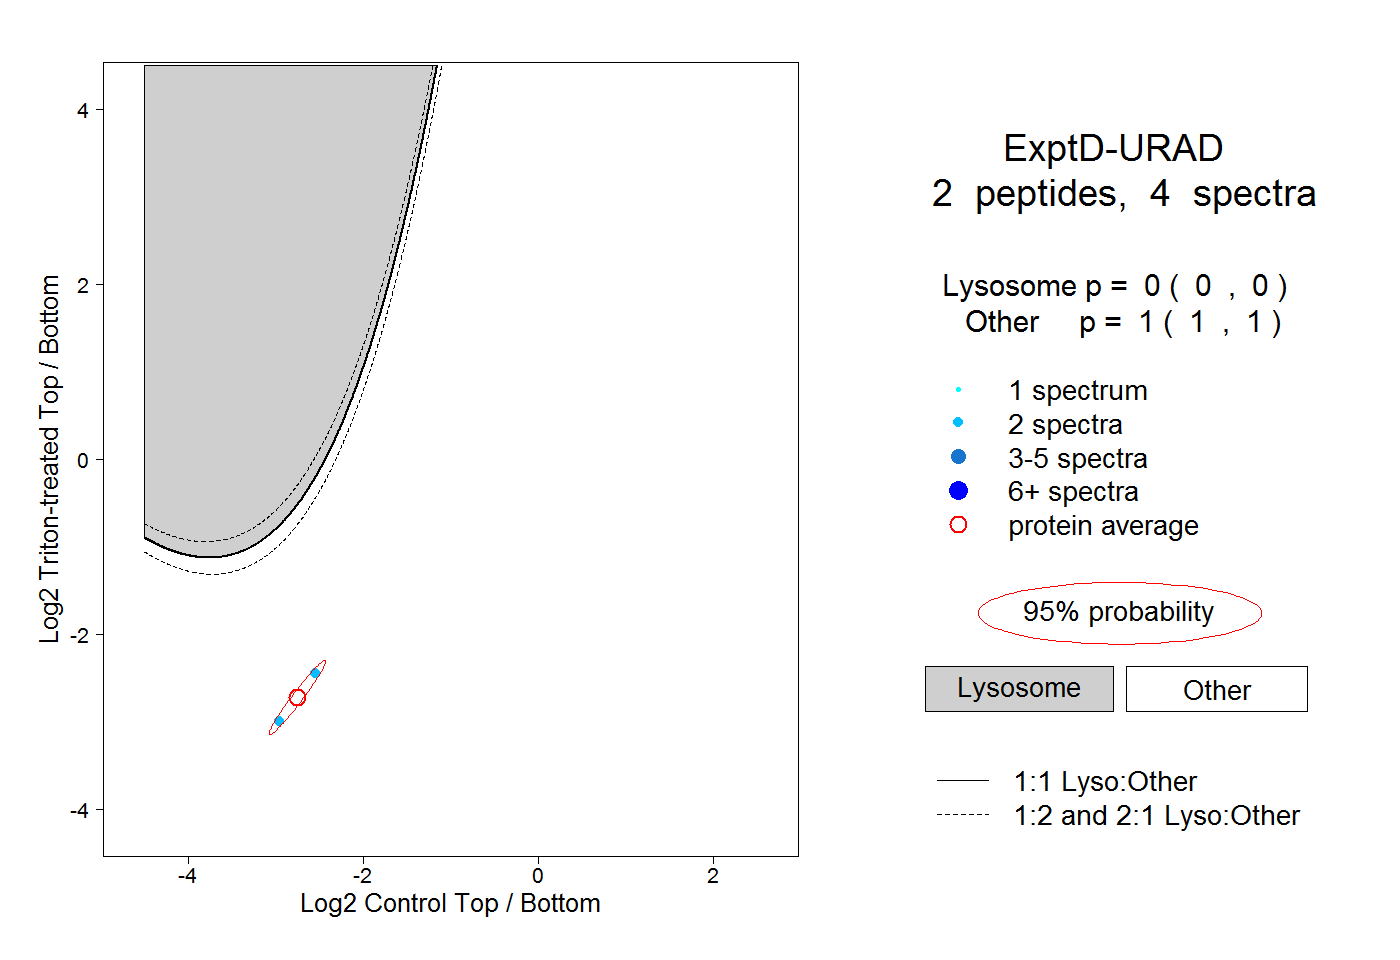 |
0.000 0.000 | 0.000 |
1.000 1.000 | 1.000 |