 3
3peptides
spectra
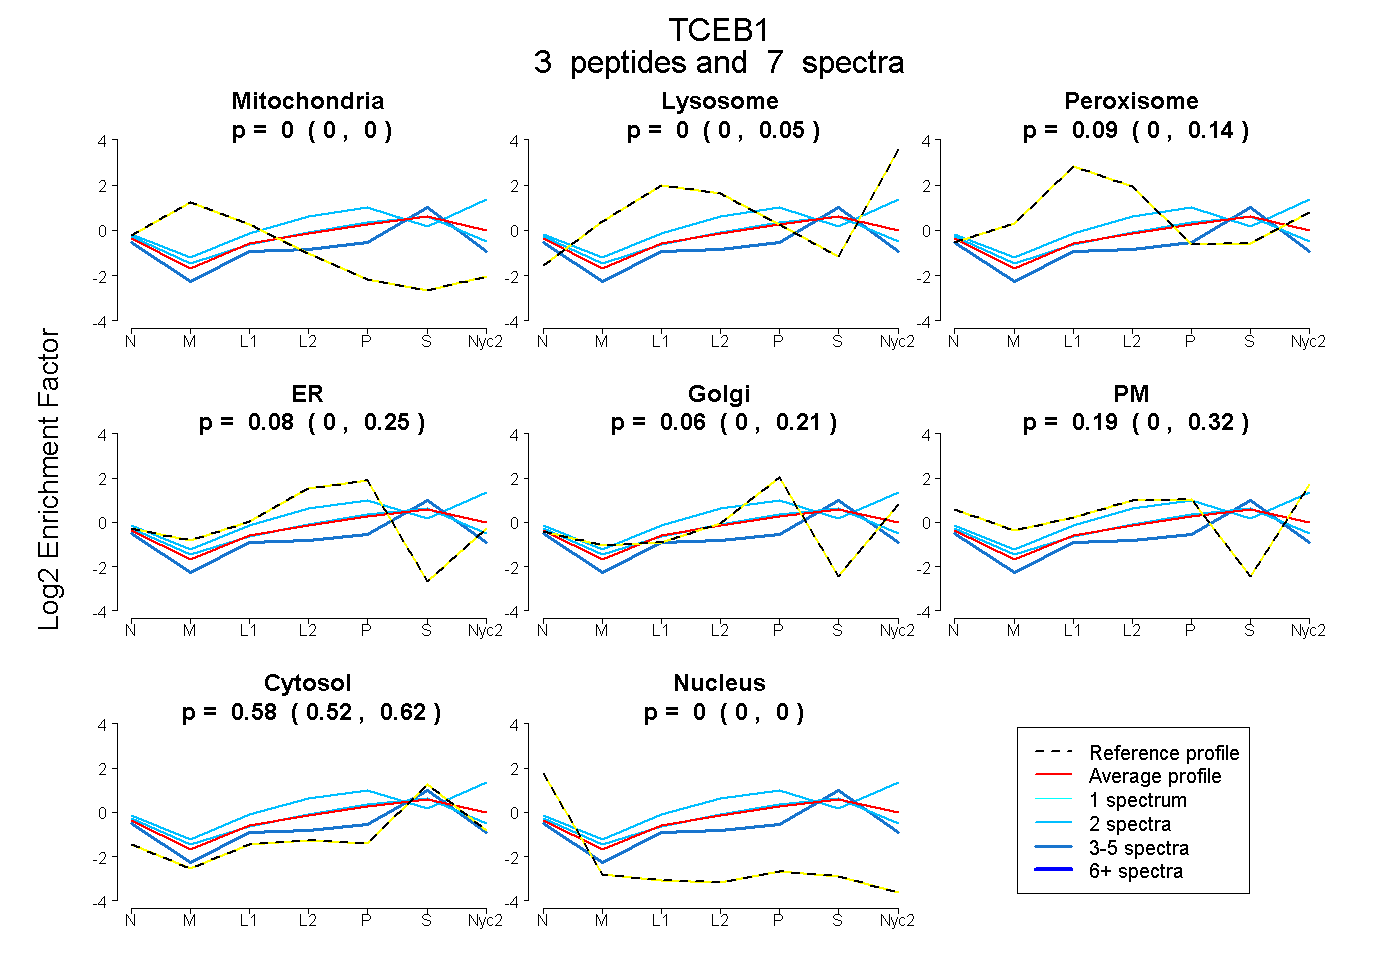
0.000 | 0.000
0.000 | 0.055
0.000 | 0.138
0.000 | 0.247
0.000 | 0.215
0.000 | 0.315
0.522 | 0.619
0.000 | 0.000
| Plot | Mito | Lyso | Perox | ER | Golgi | PM | Cytosol | Nucleus | |||||
| Expt A |
3 peptides |
7 spectra |
|
0.000 0.000 | 0.000 |
0.000 0.000 | 0.055 |
0.086 0.000 | 0.138 |
0.080 0.000 | 0.247 |
0.065 0.000 | 0.215 |
0.190 0.000 | 0.315 |
0.579 0.522 | 0.619 |
0.000 0.000 | 0.000 |
| 3 spectra, EIPSHVLSK | 0.000 | 0.000 | 0.043 | 0.143 | 0.000 | 0.000 | 0.792 | 0.022 | ||
| 2 spectra, TYGGCEGPDAMYVK | 0.000 | 0.000 | 0.076 | 0.265 | 0.000 | 0.073 | 0.585 | 0.000 | ||
| 2 spectra, EHALTSGTIK | 0.000 | 0.223 | 0.000 | 0.000 | 0.094 | 0.339 | 0.344 | 0.000 |
| Plot | Lyso | Other | |||||||||||
| Expt C |
4 peptides |
5 spectra |
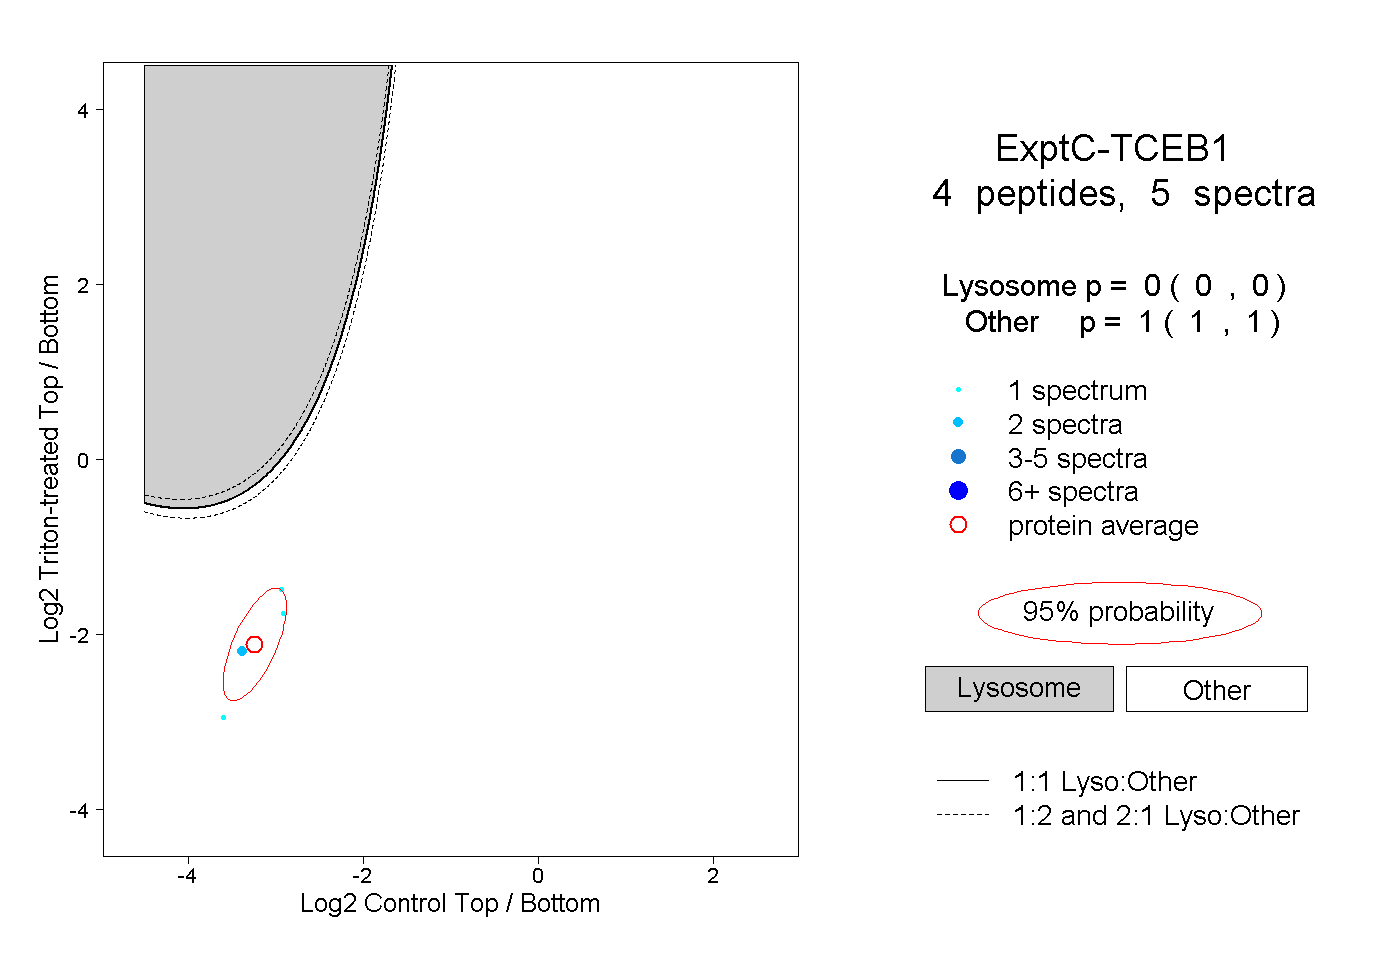 |
0.000 0.000 | 0.000 |
1.000 1.000 | 1.000 |