13
13peptides
spectra
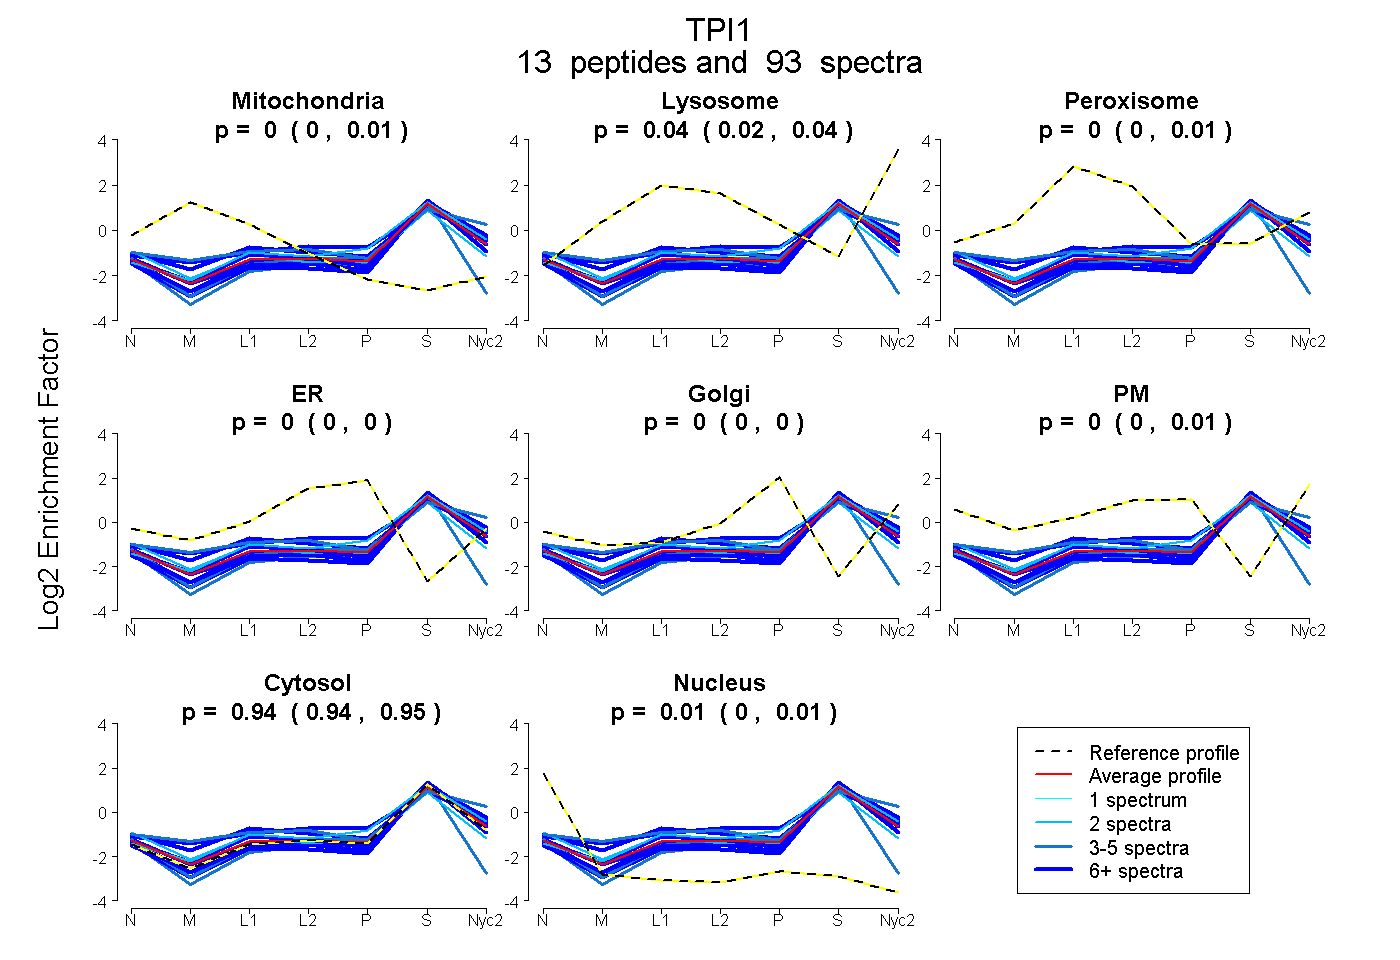
0.000 | 0.011
0.020 | 0.044
0.000 | 0.011
0.000 | 0.000
0.000 | 0.000
0.000 | 0.011
0.941 | 0.949
0.002 | 0.015
11peptides
spectra
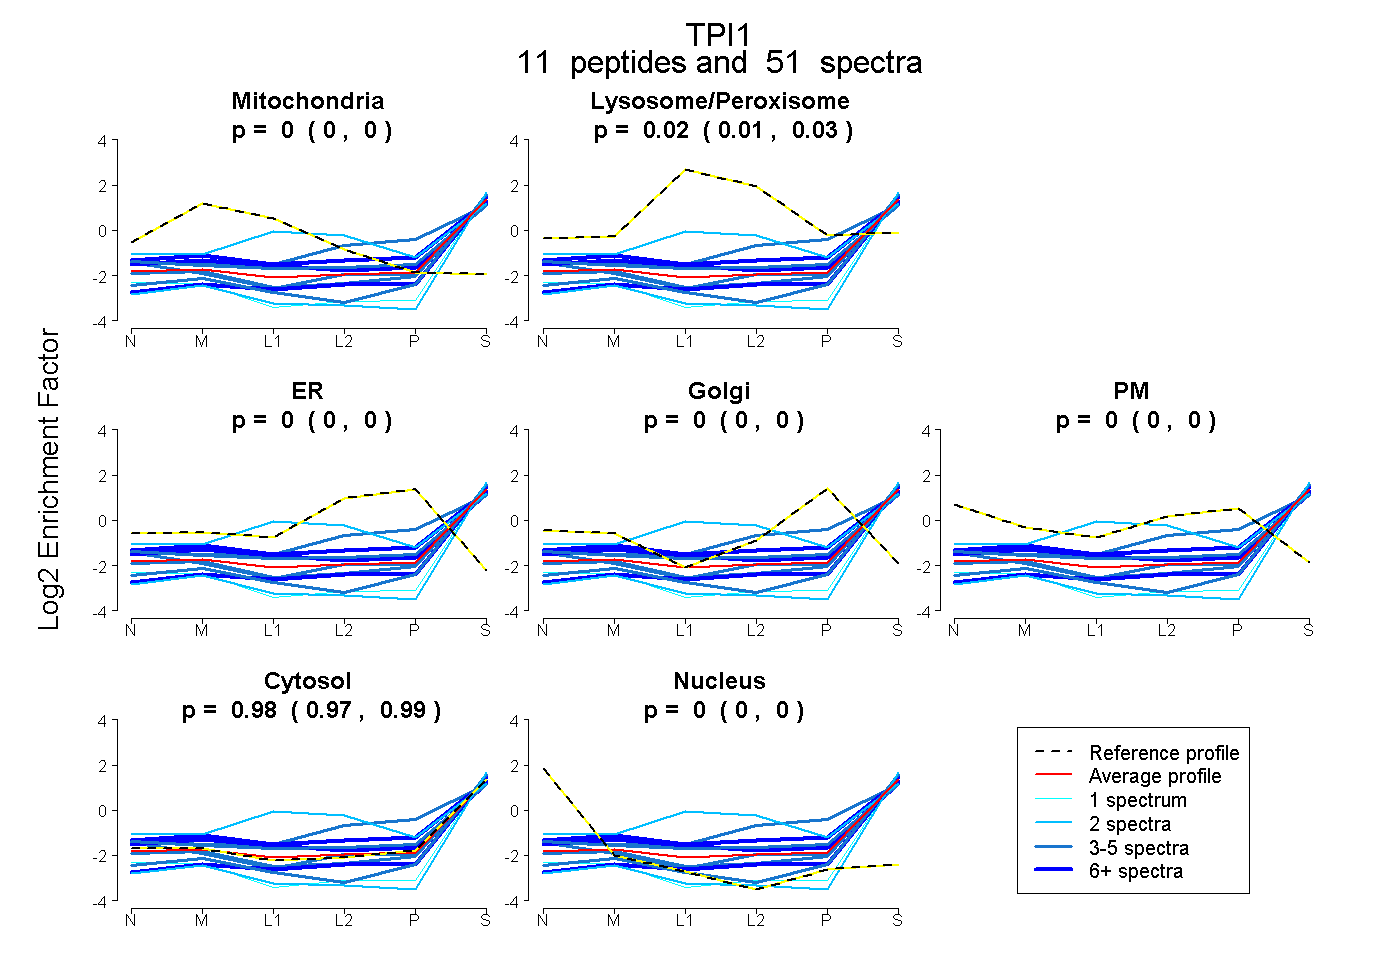
0.000 | 0.000
0.009 | 0.025
0.000 | 0.000
0.000 | 0.000
0.000 | 0.000
0.974 | 0.990
0.000 | 0.000
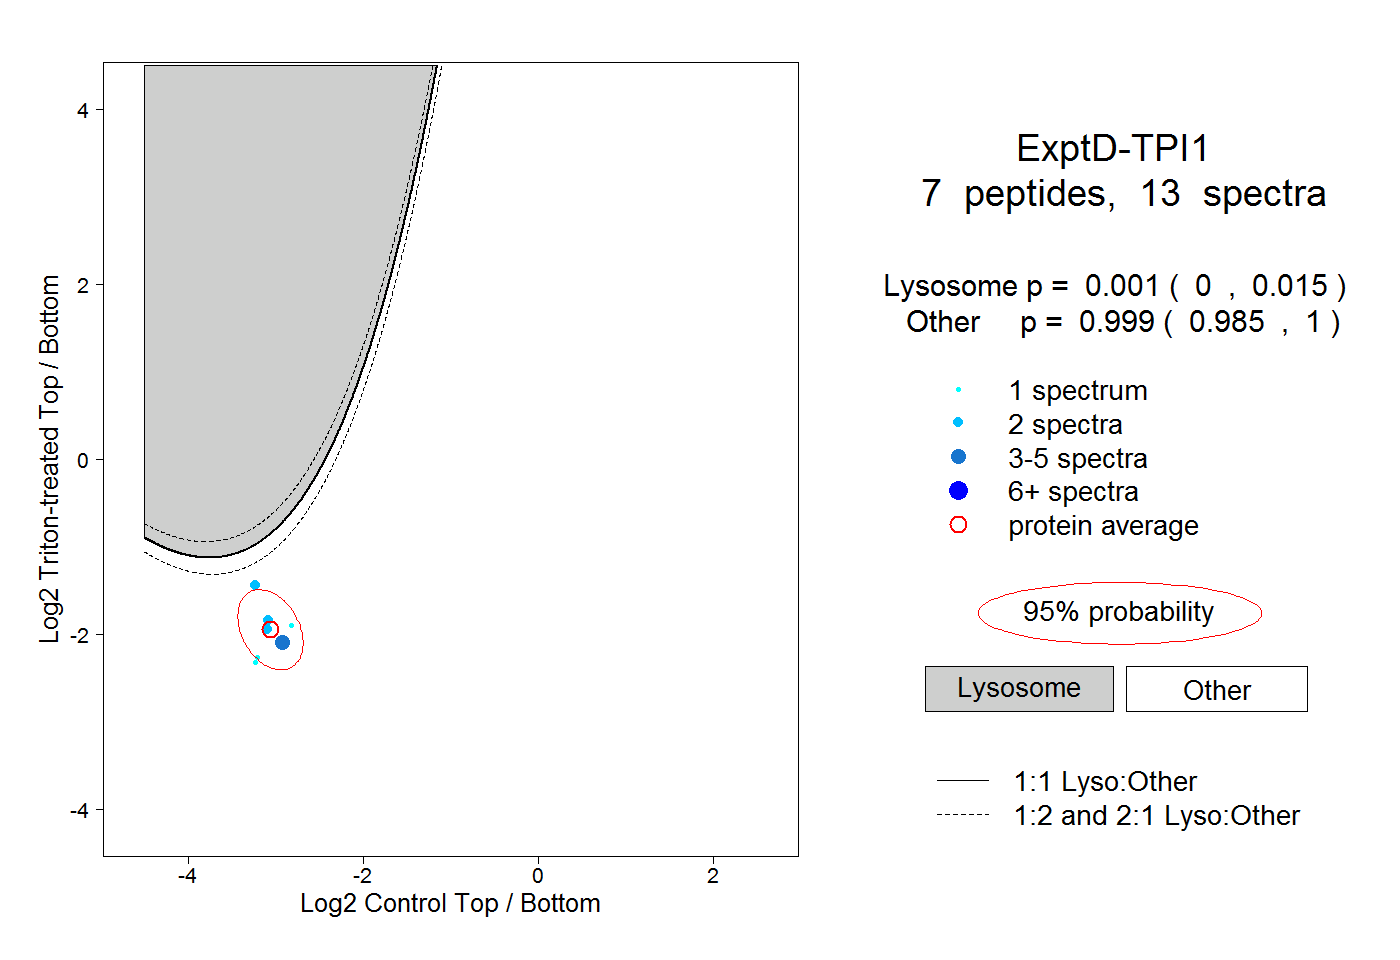
14peptides
spectra
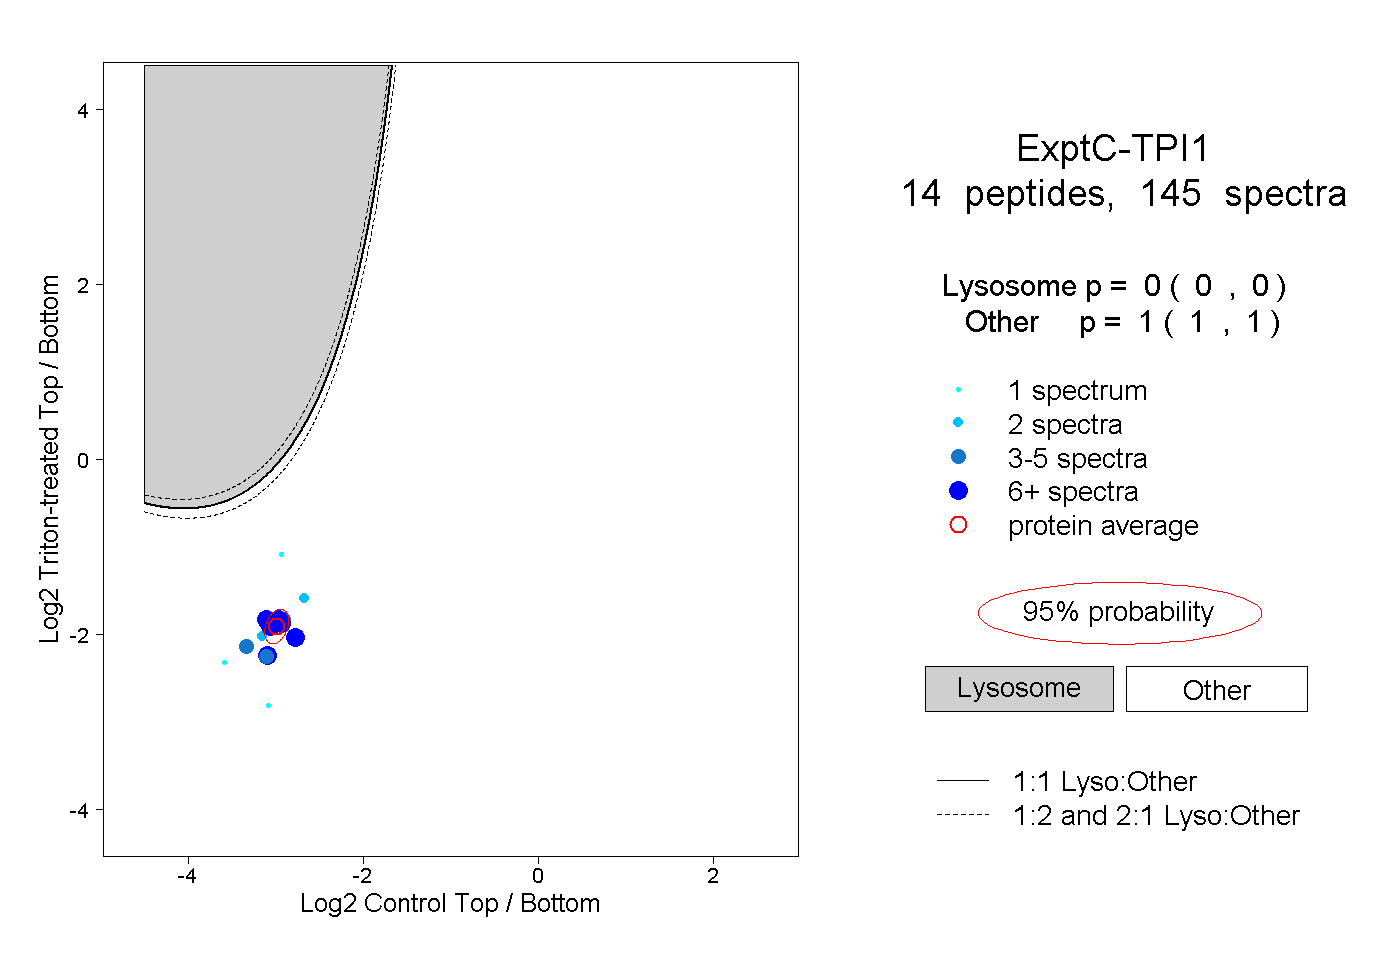
0.000 | 0.000
1.000 | 1.000