 13
13peptides
spectra
0.000 | 0.011
0.020 | 0.044
0.000 | 0.011
0.000 | 0.000
0.000 | 0.000
0.000 | 0.011
0.941 | 0.949
0.002 | 0.015
| Plot | Mito | Lyso | Perox | ER | Golgi | PM | Cytosol | Nucleus | |||||
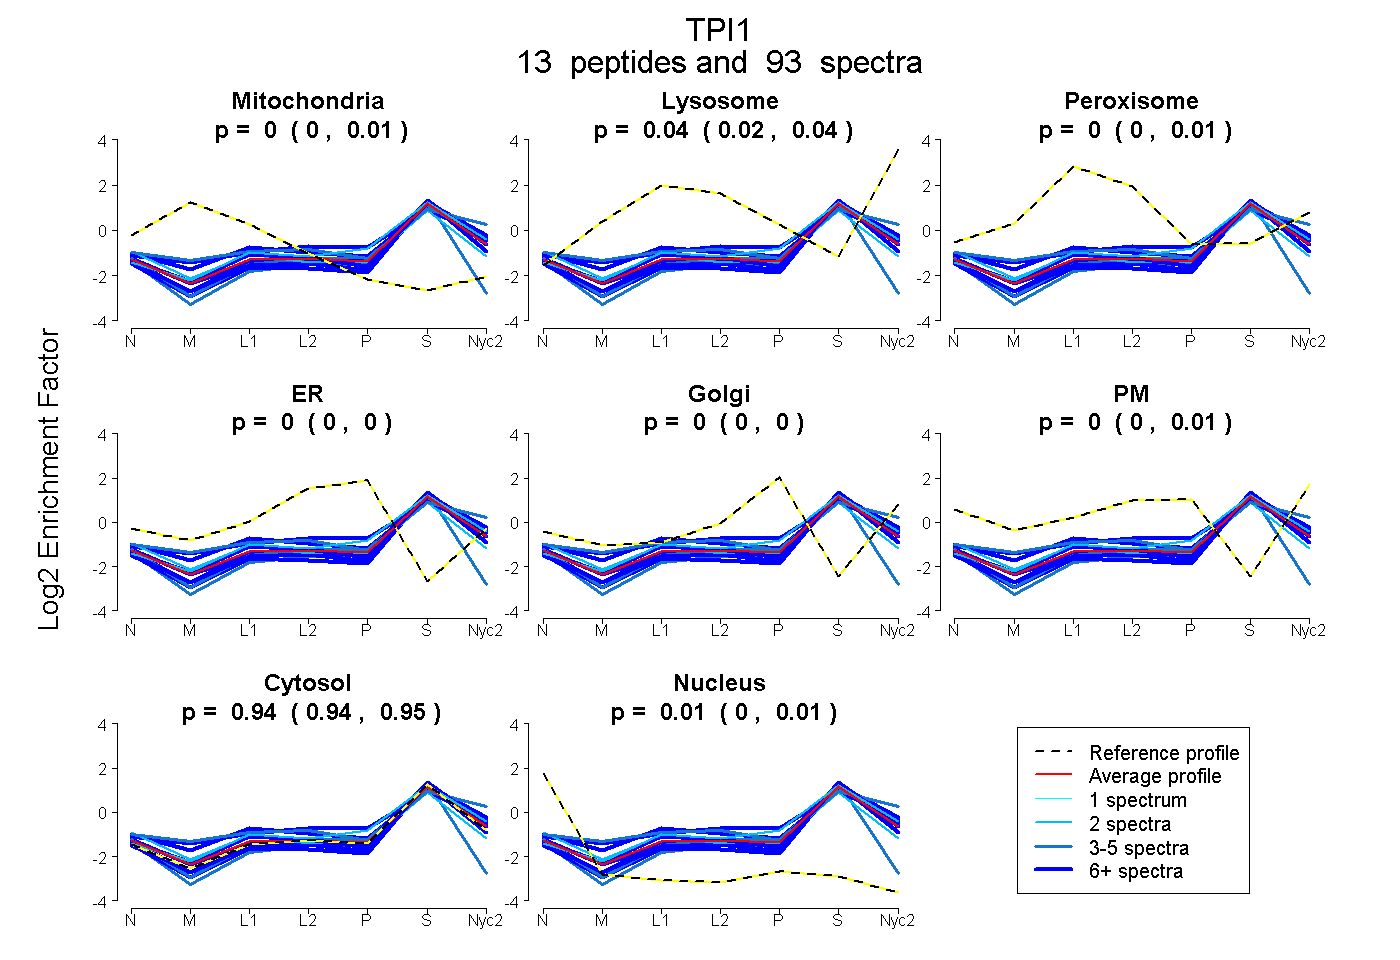
| Expt A |
13 peptides |
93 spectra |
|
0.000 0.000 | 0.011 |
0.038 0.020 | 0.044 |
0.005 0.000 | 0.011 |
0.000 0.000 | 0.000 |
0.000 0.000 | 0.000 |
0.000 0.000 | 0.011 |
0.943 0.941 | 0.949 |
0.014 0.002 | 0.015 |
| 9 spectra, VVFEQTK | 0.000 | 0.040 | 0.030 | 0.000 | 0.000 | 0.000 | 0.929 | 0.000 | ||
| 12 spectra, TATPQQAQEVHEK | 0.000 | 0.013 | 0.000 | 0.000 | 0.000 | 0.000 | 0.987 | 0.000 | ||
| 3 spectra, IIYGGSVTGATCK | 0.000 | 0.000 | 0.000 | 0.000 | 0.033 | 0.007 | 0.960 | 0.000 | ||
| 6 spectra, HIFGESDELIGQK | 0.035 | 0.041 | 0.105 | 0.000 | 0.000 | 0.022 | 0.796 | 0.000 | ||
| 4 spectra, VTNGAFTGEISPGMIK | 0.055 | 0.198 | 0.000 | 0.000 | 0.000 | 0.000 | 0.747 | 0.000 | ||
| 2 spectra, VNHALSEGLGVIACIGEK | 0.066 | 0.000 | 0.045 | 0.000 | 0.000 | 0.000 | 0.830 | 0.060 | ||
| 2 spectra, VVLAYEPVWAIGTGK | 0.000 | 0.083 | 0.000 | 0.000 | 0.033 | 0.000 | 0.884 | 0.000 | ||
| 8 spectra, EAGITEK | 0.000 | 0.000 | 0.000 | 0.000 | 0.000 | 0.000 | 0.983 | 0.017 | ||
| 8 spectra, AIADNVK | 0.000 | 0.000 | 0.000 | 0.000 | 0.000 | 0.000 | 1.000 | 0.000 | ||
| 14 spectra, FFVGGNWK | 0.000 | 0.050 | 0.000 | 0.000 | 0.000 | 0.006 | 0.943 | 0.000 | ||
| 5 spectra, CNVSEGVAQCTR | 0.000 | 0.000 | 0.000 | 0.000 | 0.000 | 0.000 | 0.845 | 0.155 | ||
| 7 spectra, IAVAAQNCYK | 0.000 | 0.000 | 0.000 | 0.000 | 0.000 | 0.000 | 0.973 | 0.027 | ||
| 13 spectra, DLGATWVVLGHSER | 0.019 | 0.078 | 0.072 | 0.000 | 0.063 | 0.019 | 0.748 | 0.000 |
| Plot | Mito | Lyso or Perox | ER | Golgi | PM | Cytosol | Nucleus | ||||||
| Expt B |
11 peptides |
51 spectra |
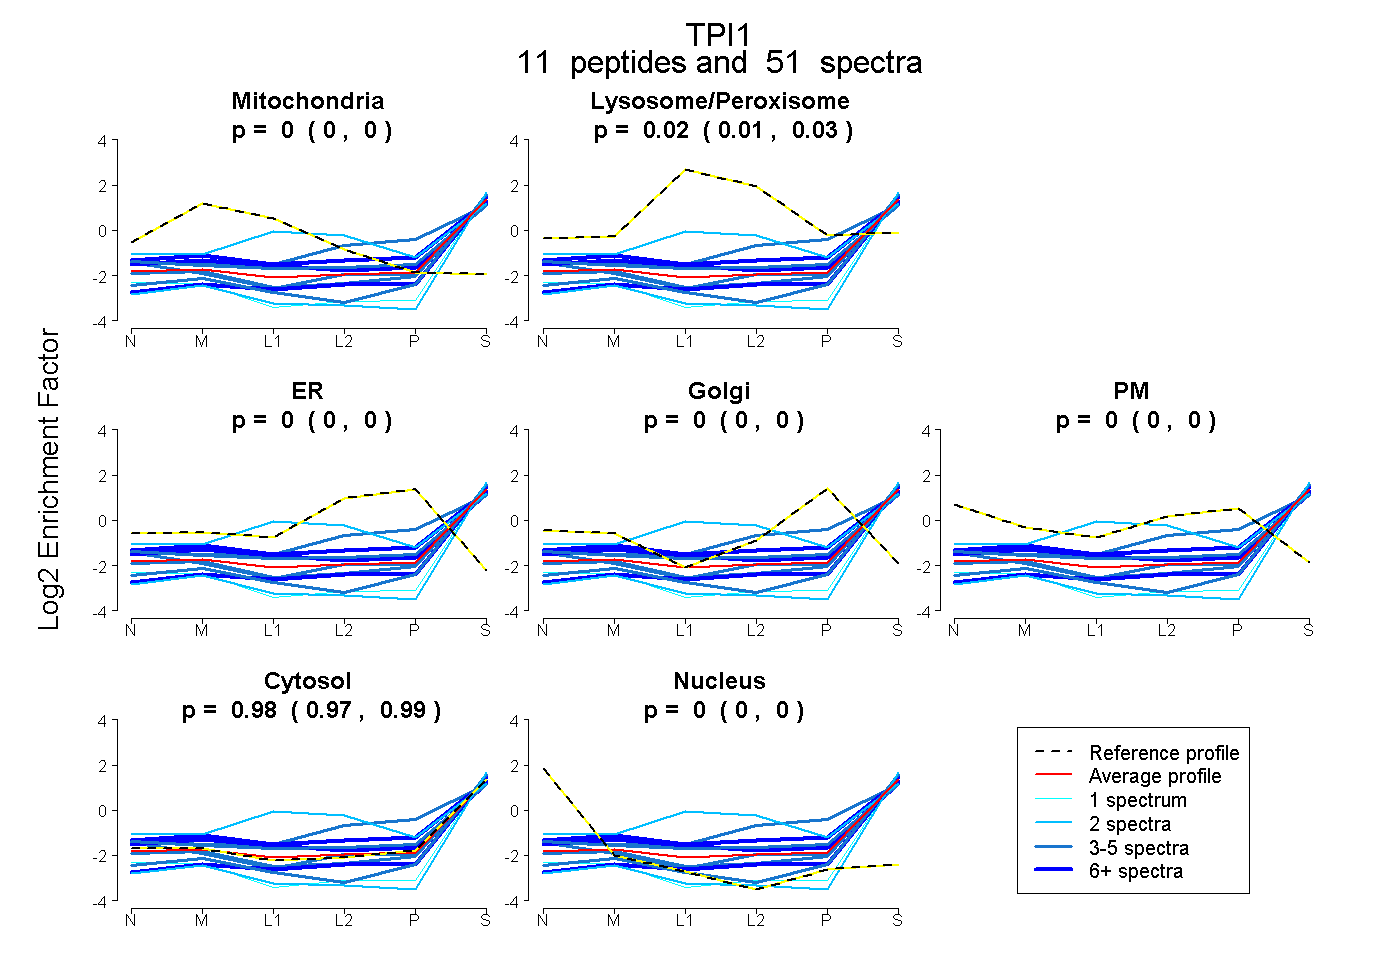 |
0.000 0.000 | 0.000 |
0.018 0.009 | 0.025 |
0.000 0.000 | 0.000 |
0.000 0.000 | 0.000 |
0.000 0.000 | 0.000 |
0.982 0.974 | 0.990 |
0.000 0.000 | 0.000 |
|||
| Plot | Lyso | Other | |||||||||||
| Expt C |
14 peptides |
145 spectra |
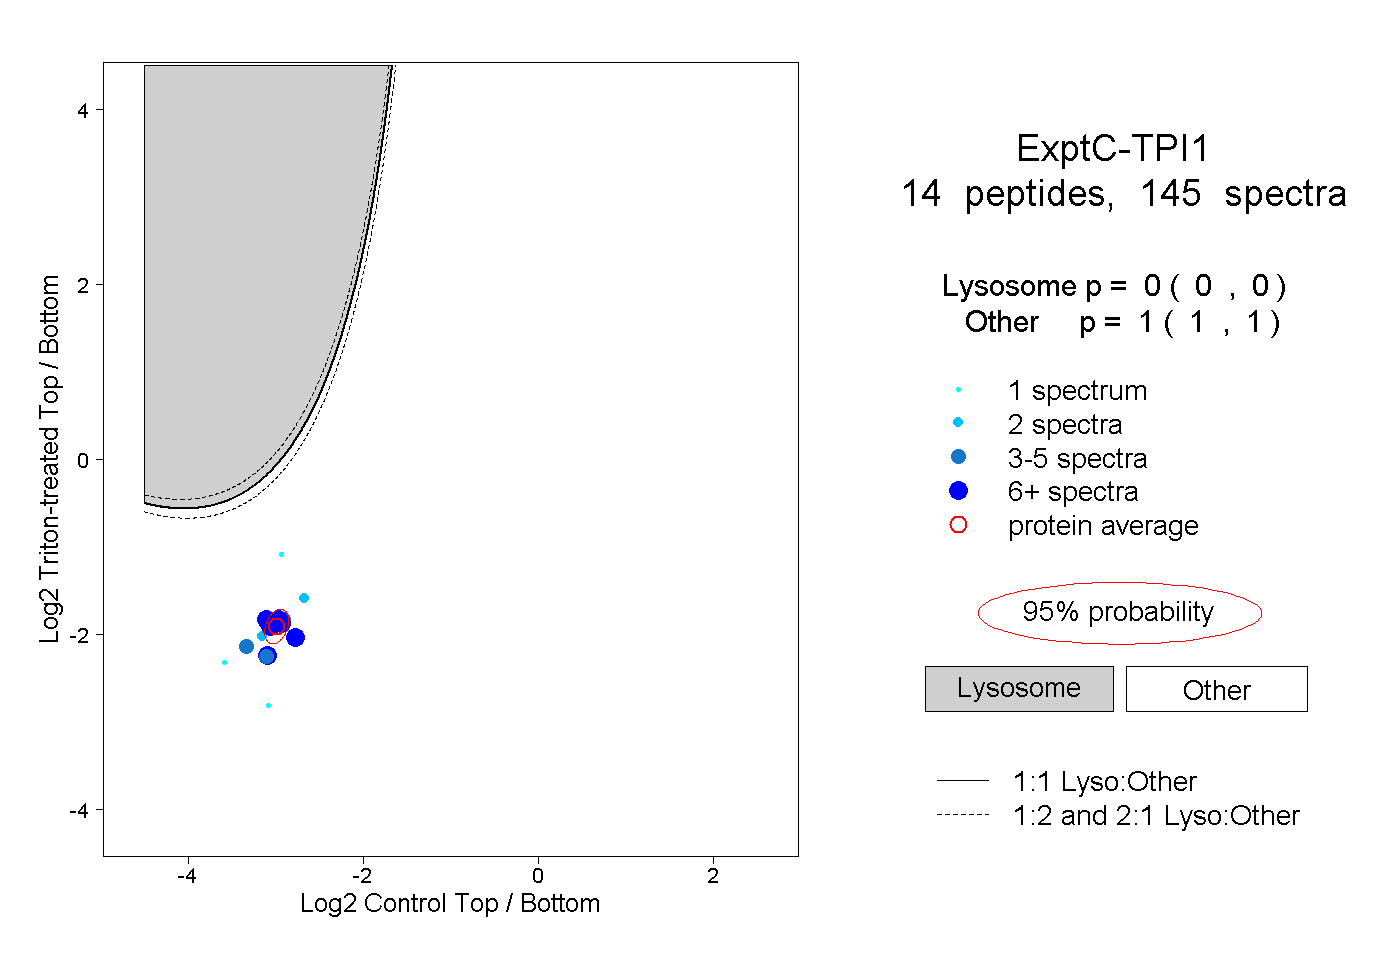 |
0.000 0.000 | 0.000 |
1.000 1.000 | 1.000 |
||||||||
| Plot | Lyso | Other | |||||||||||
| Expt D |
7 peptides |
13 spectra |
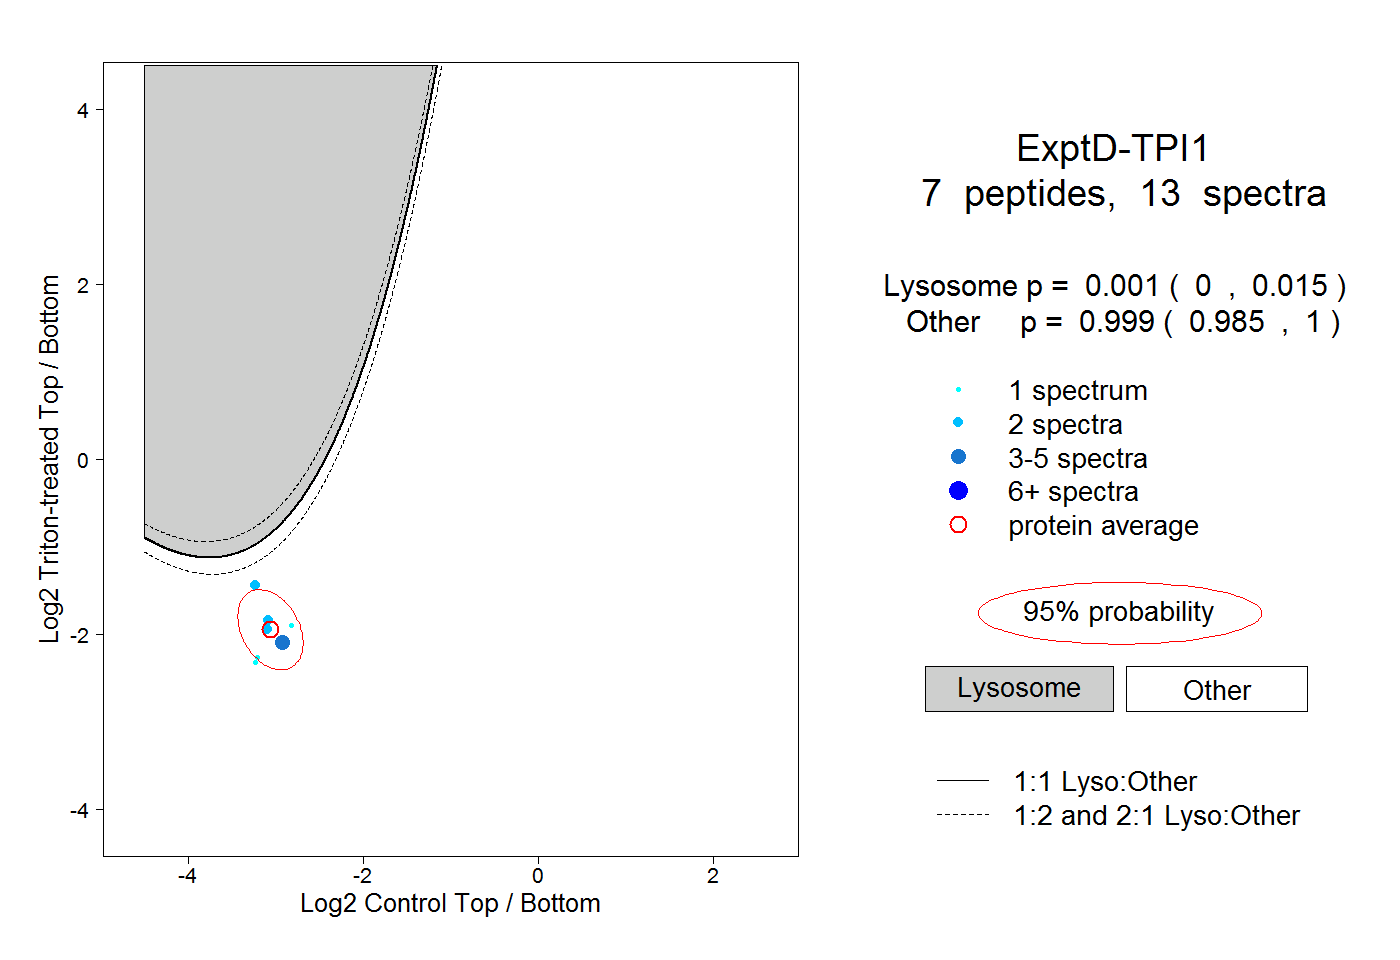 |
0.001 0.000 | 0.015 |
0.999 0.985 | 1.000 |