17
17peptides
spectra
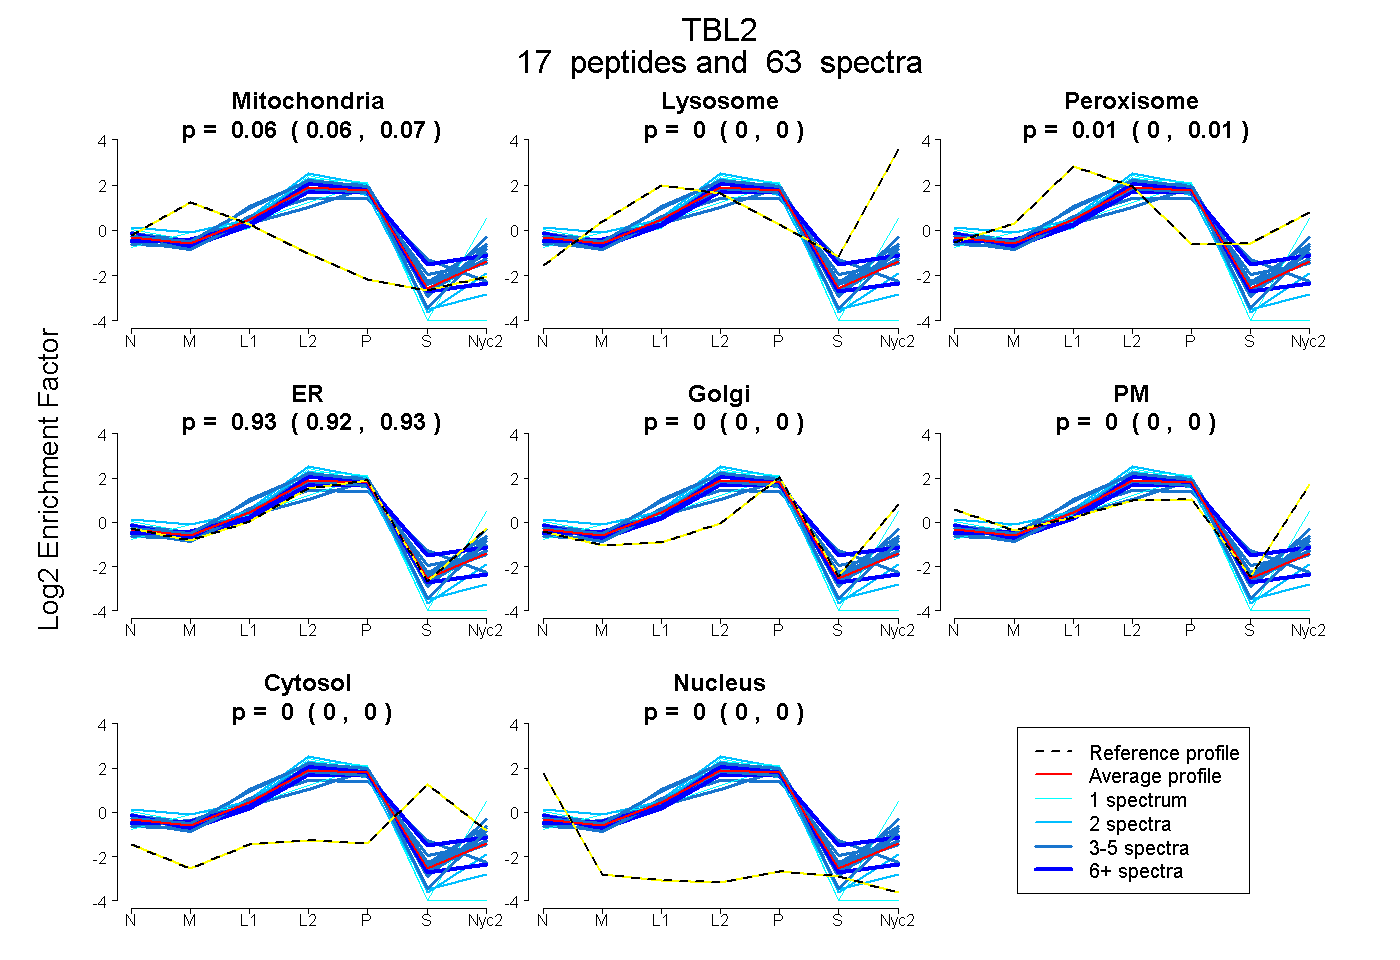
0.059 | 0.069
0.000 | 0.000
0.000 | 0.015
0.923 | 0.932
0.000 | 0.000
0.000 | 0.000
0.000 | 0.000
0.000 | 0.000
10peptides
spectra
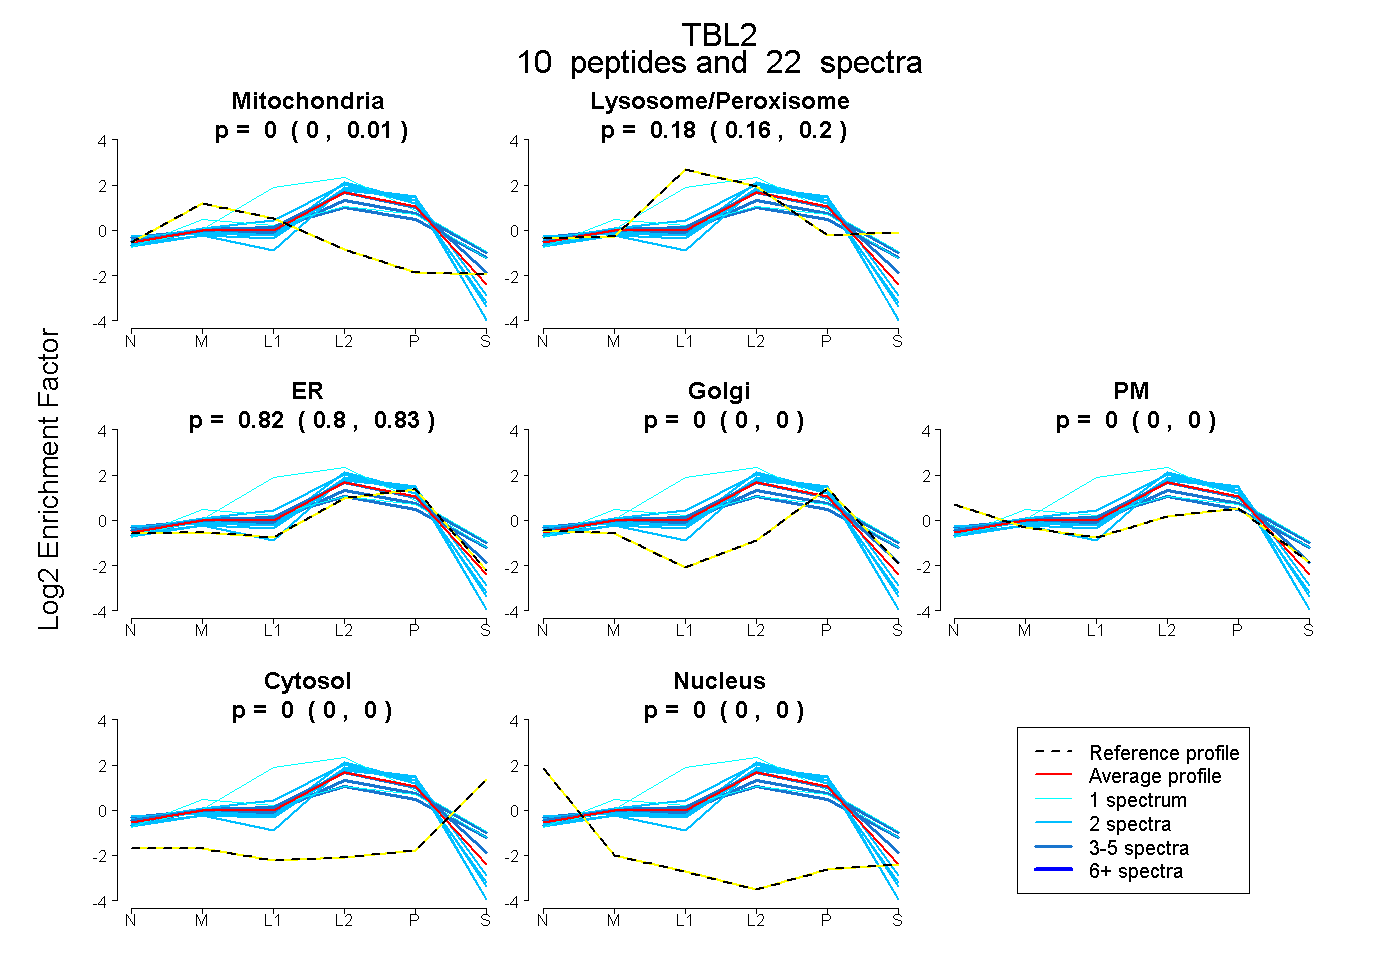
0.000 | 0.012
0.156 | 0.199
0.797 | 0.834
0.000 | 0.000
0.000 | 0.000
0.000 | 0.000
0.000 | 0.000
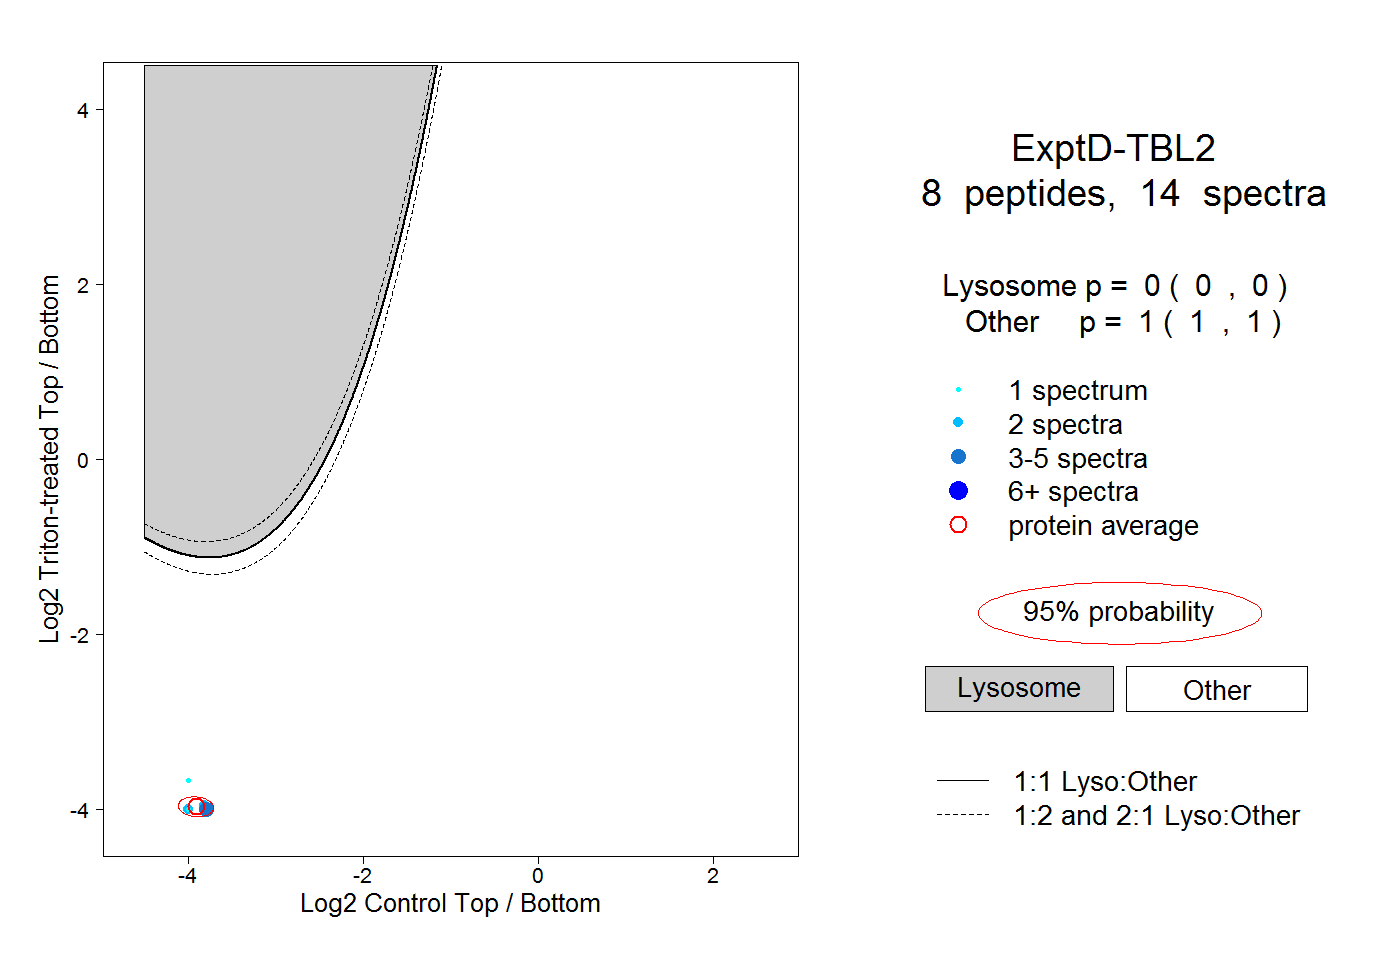
16peptides
spectra
0.000 | 0.000
1.000 | 1.000