TBL2
[ENSRNOP00000067401]
Main page
| | | Plot |
Mito |
Lyso |
|
Perox |
ER |
Golgi |
PM |
Cytosol |
Nucleus |
|
| Expt A |
 17
17
peptides |
63
spectra |
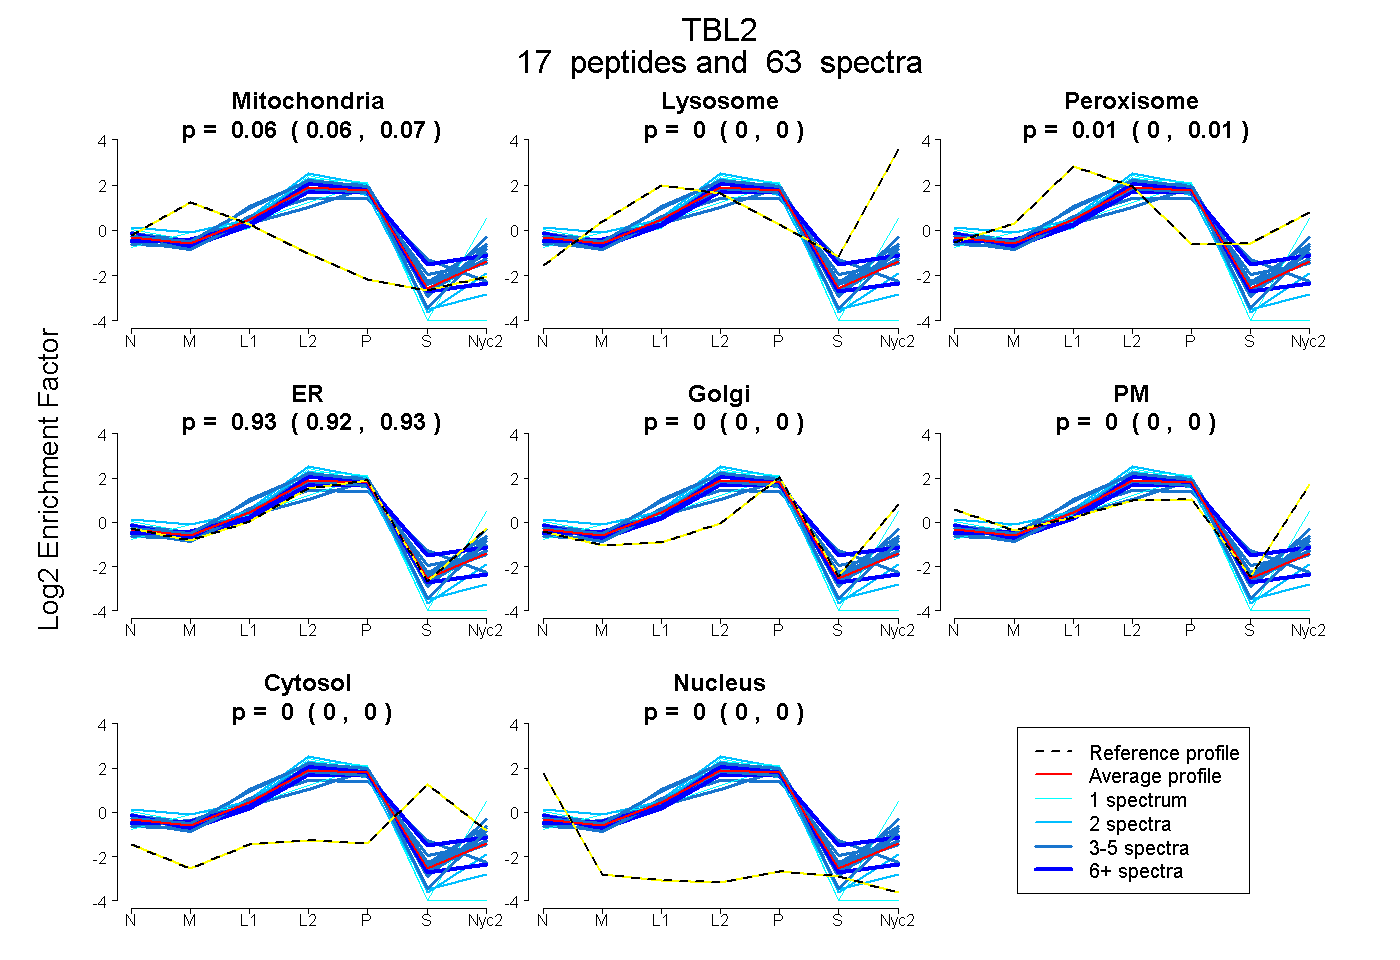 |
0.064
0.059 | 0.069 |
0.000
0.000 | 0.000 |
|
0.008
0.000 | 0.015 |
0.928
0.923 | 0.932 |
0.000
0.000 | 0.000 |
0.000
0.000 | 0.000 |
0.000
0.000 | 0.000 |
0.000
0.000 | 0.000 |
|
| | | Plot |
Mito |
|
Lyso or Perox |
|
ER |
Golgi |
PM |
Cytosol |
Nucleus |
|
| Expt B |
10
peptides |
22
spectra |
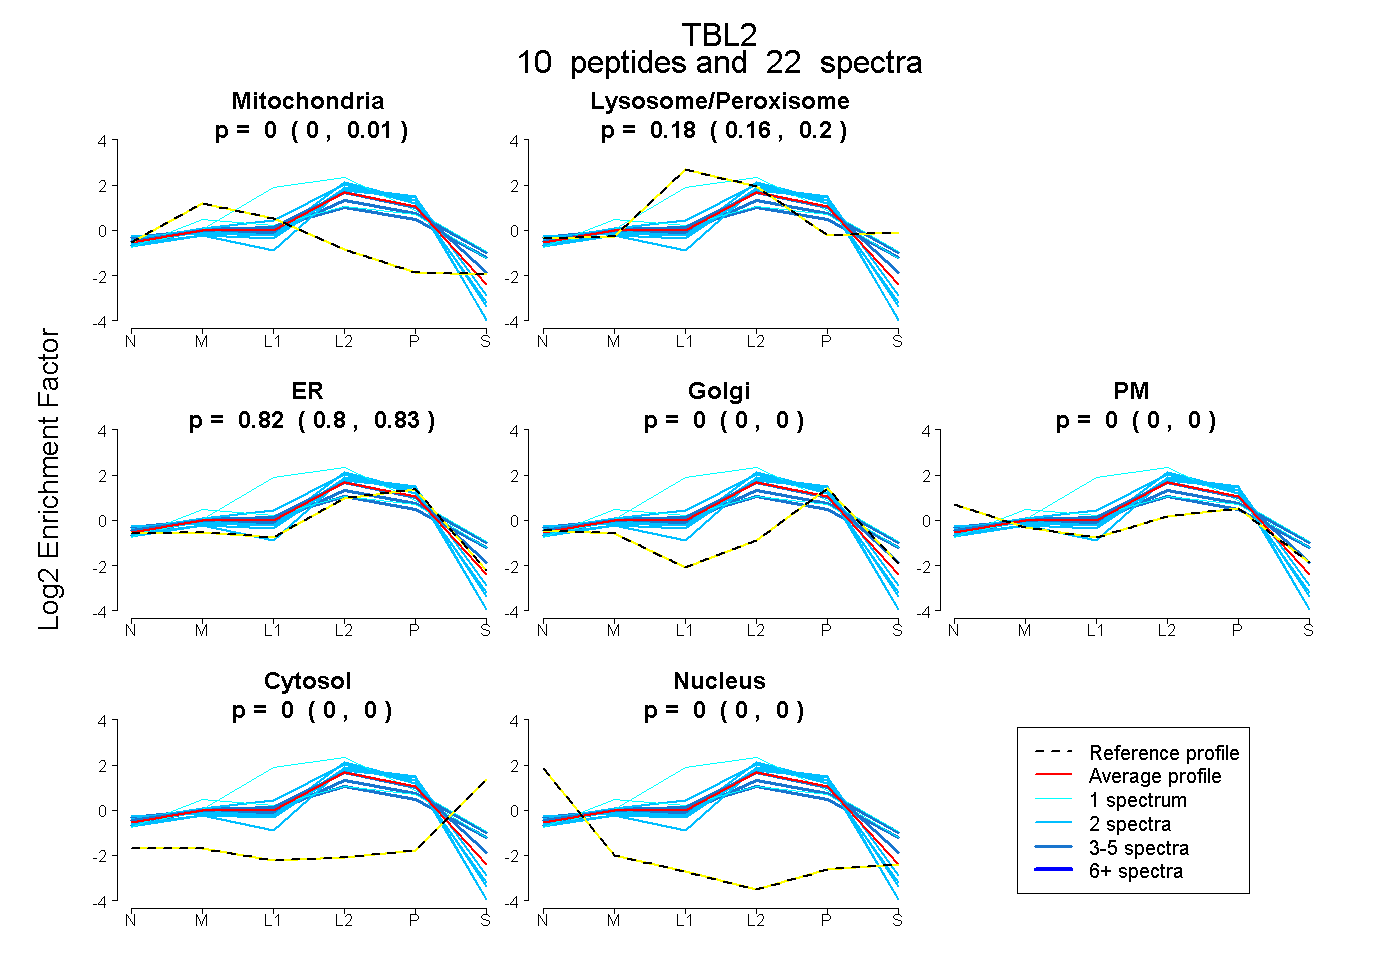 |
0.000
0.000 | 0.012 |
|
0.182
0.156 | 0.199 |
|
0.818
0.797 | 0.834 |
0.000
0.000 | 0.000 |
0.000
0.000 | 0.000 |
0.000
0.000 | 0.000 |
0.000
0.000 | 0.000 |
|
| 2 spectra, LQQQLTQAQEALK |
0.000 |
|
0.000 |
|
1.000 |
0.000 |
0.000 |
0.000 |
0.000 |
|
| 2 spectra, GEFQEVLR |
0.000 |
|
0.000 |
|
1.000 |
0.000 |
0.000 |
0.000 |
0.000 |
|
| 2 spectra, FVGSCGFTPDVK |
0.000 |
|
0.176 |
|
0.824 |
0.000 |
0.000 |
0.000 |
0.000 |
|
| 4 spectra, YLATCADDR |
0.000 |
|
0.261 |
|
0.739 |
0.000 |
0.000 |
0.000 |
0.000 |
|
| 3 spectra, APIINIGIADTGK |
0.000 |
|
0.297 |
|
0.513 |
0.000 |
0.147 |
0.043 |
0.000 |
|
| 2 spectra, QQDPYLLR |
0.000 |
|
0.038 |
|
0.962 |
0.000 |
0.000 |
0.000 |
0.000 |
|
| 1 spectrum, LFHNTPGHR |
0.000 |
|
0.703 |
|
0.297 |
0.000 |
0.000 |
0.000 |
0.000 |
|
| 2 spectra, FLASCGDR |
0.000 |
|
0.034 |
|
0.966 |
0.000 |
0.000 |
0.000 |
0.000 |
|
| 3 spectra, AVVEEMQGLLK |
0.113 |
|
0.280 |
|
0.558 |
0.000 |
0.000 |
0.049 |
0.000 |
|
| 1 spectrum, VWEVCFGK |
0.151 |
|
0.281 |
|
0.536 |
0.031 |
0.000 |
0.000 |
0.000 |
|
| | | Plot |
|
Lyso |
|
|
|
|
|
|
|
Other |
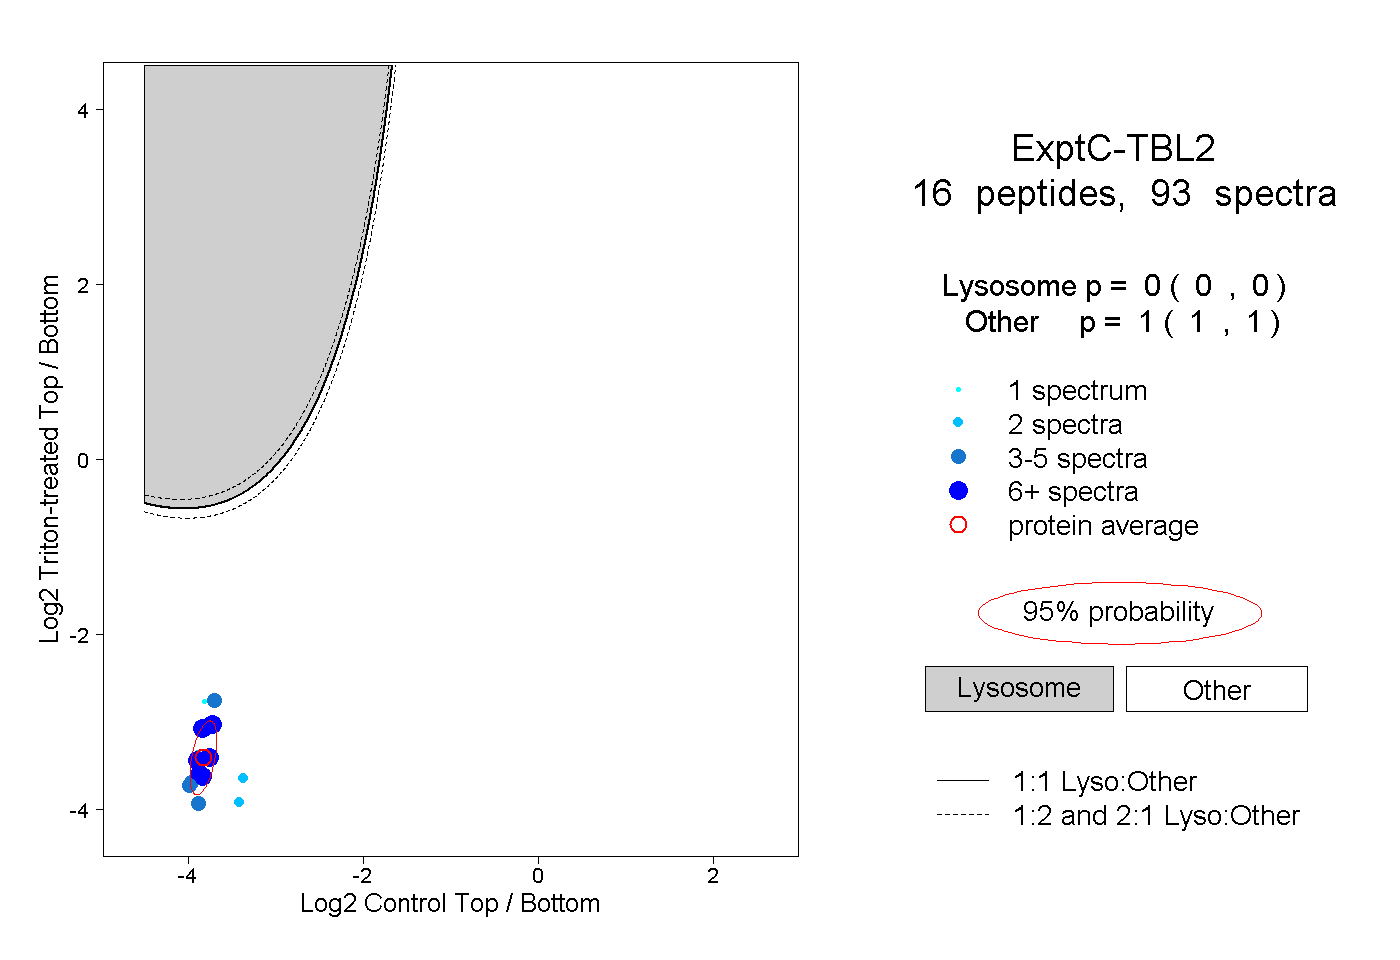
| Expt C |
16
peptides |
93
spectra |
 |
|
0.000
0.000 | 0.000 |
|
|
|
|
|
|
|
1.000
1.000 | 1.000 |
| | | Plot |
|
Lyso |
|
|
|
|
|
|
|
Other |
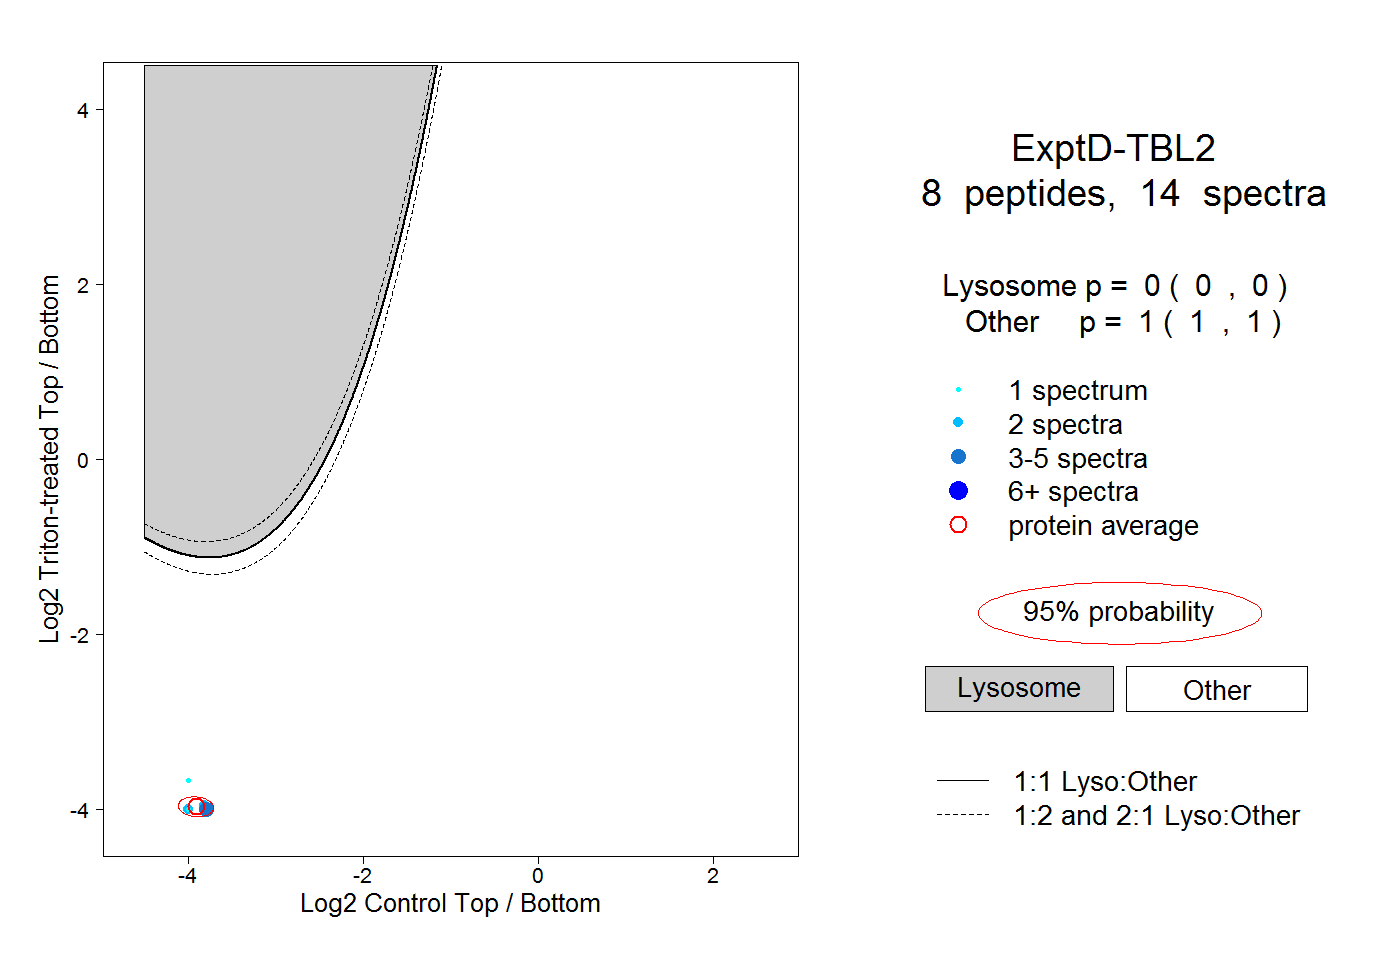
| Expt D |
8
peptides |
14
spectra |
 |
|
0.000
0.000 | 0.000 |
|
|
|
|
|
|
|
1.000
1.000 | 1.000 |