 2
2peptides
spectra
0.000 | 0.010
0.000 | 0.194
0.000 | 0.101
0.000 | 0.089
0.000 | 0.097
0.000 | 0.010
0.740 | 0.903
0.000 | 0.022
1peptide
spectra
0.000 | 0.000
1.000 | 1.000
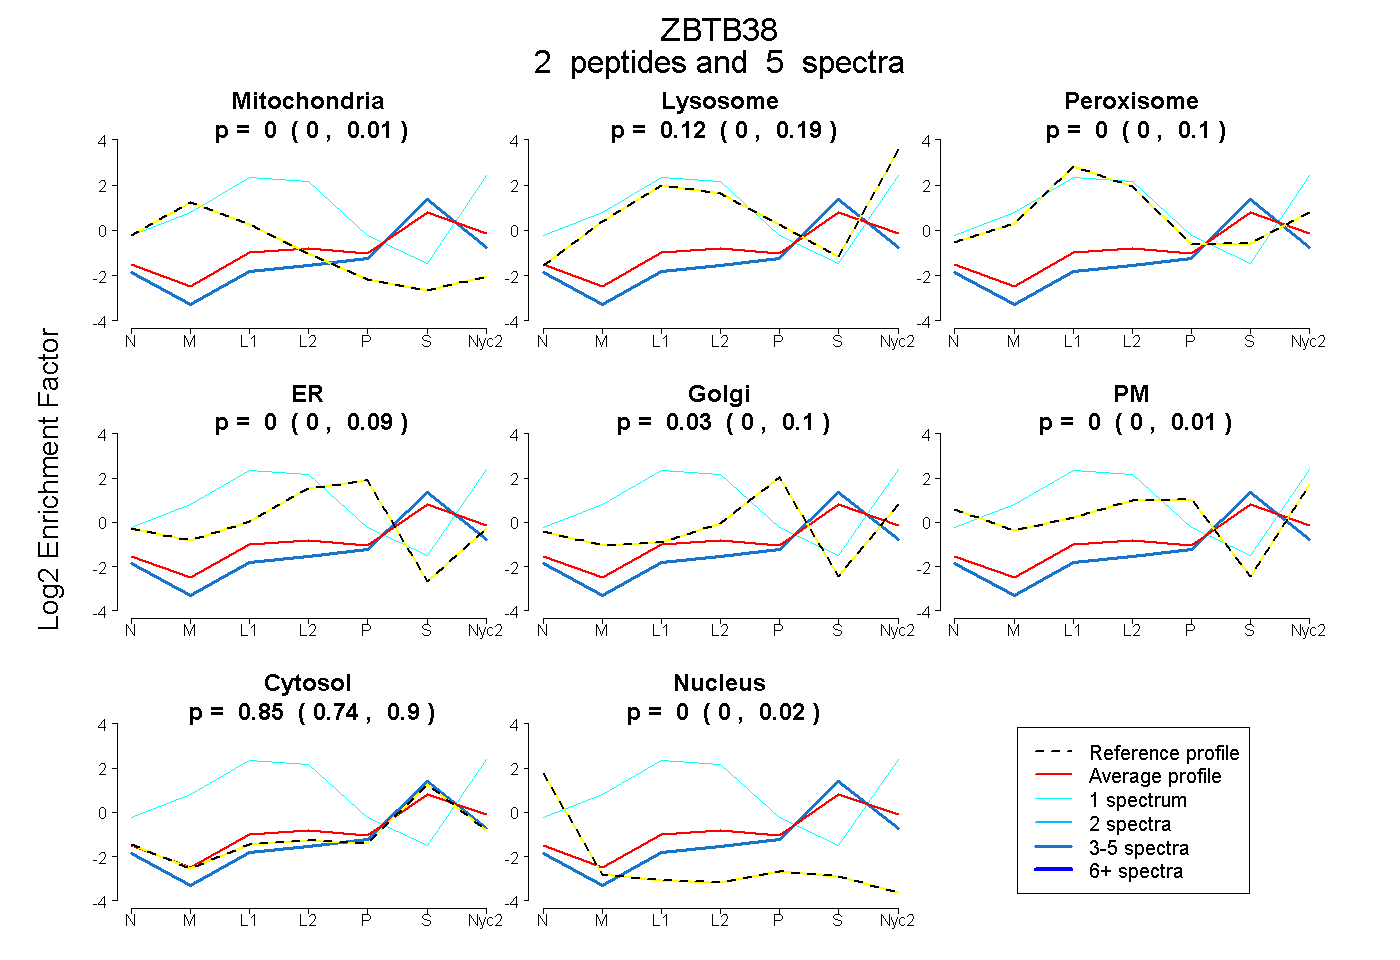
| Plot | Mito | Lyso | Perox | ER | Golgi | PM | Cytosol | Nucleus | |||||
| Expt A |
2 peptides |
5 spectra |
|
0.000 0.000 | 0.010 |
0.124 0.000 | 0.194 |
0.000 0.000 | 0.101 |
0.000 0.000 | 0.089 |
0.031 0.000 | 0.097 |
0.000 0.000 | 0.010 |
0.845 0.740 | 0.903 |
0.000 0.000 | 0.022 |
||
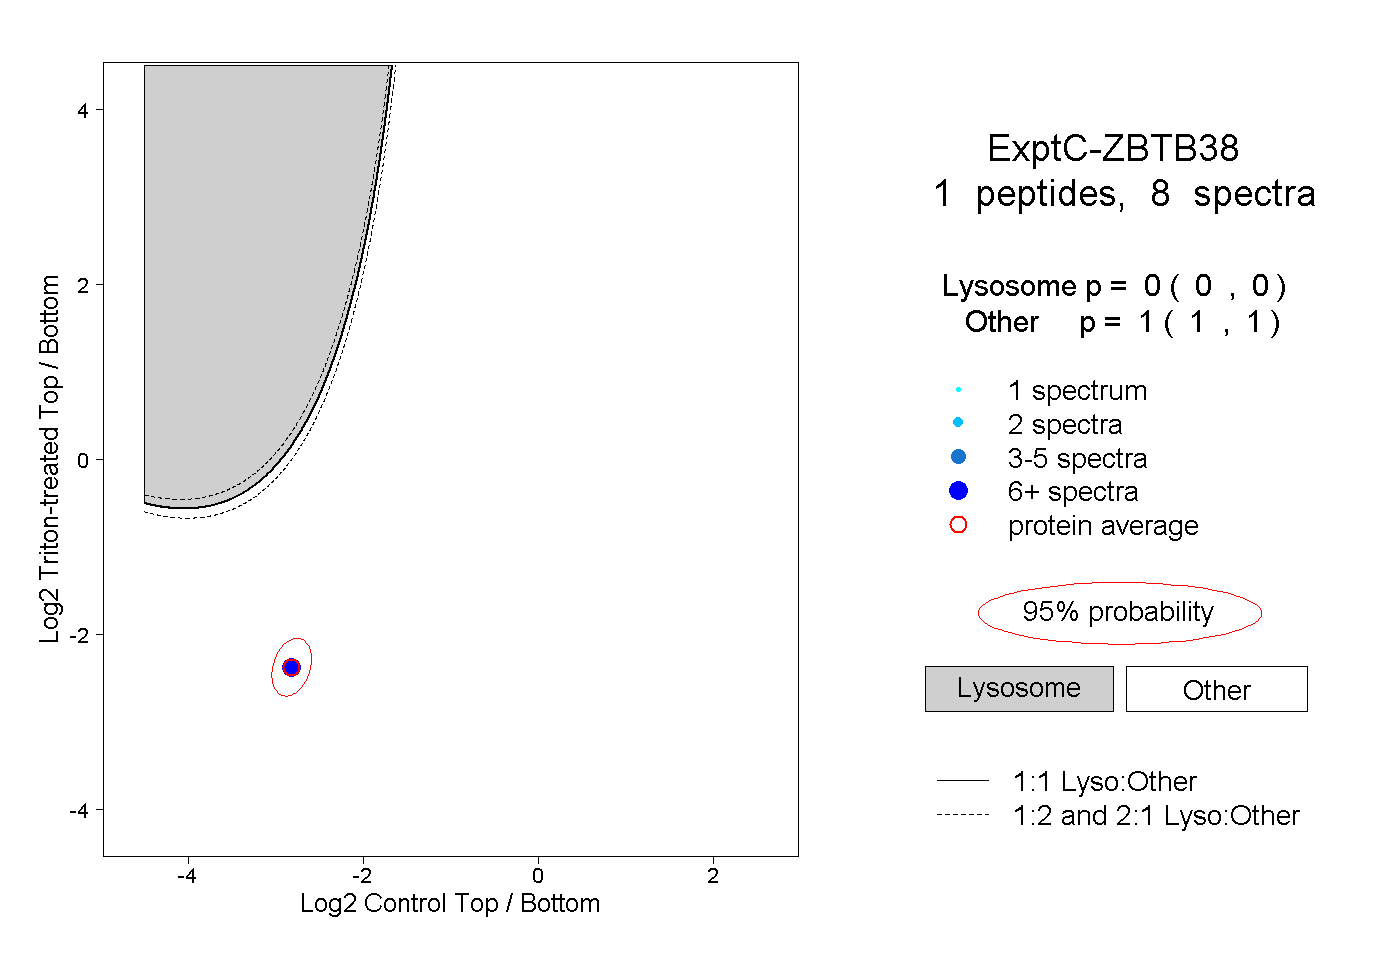
| Plot | Lyso | Other | |||||||||||
| Expt C |
1 peptide |
8 spectra |
|
0.000 0.000 | 0.000 |
1.000 1.000 | 1.000 |