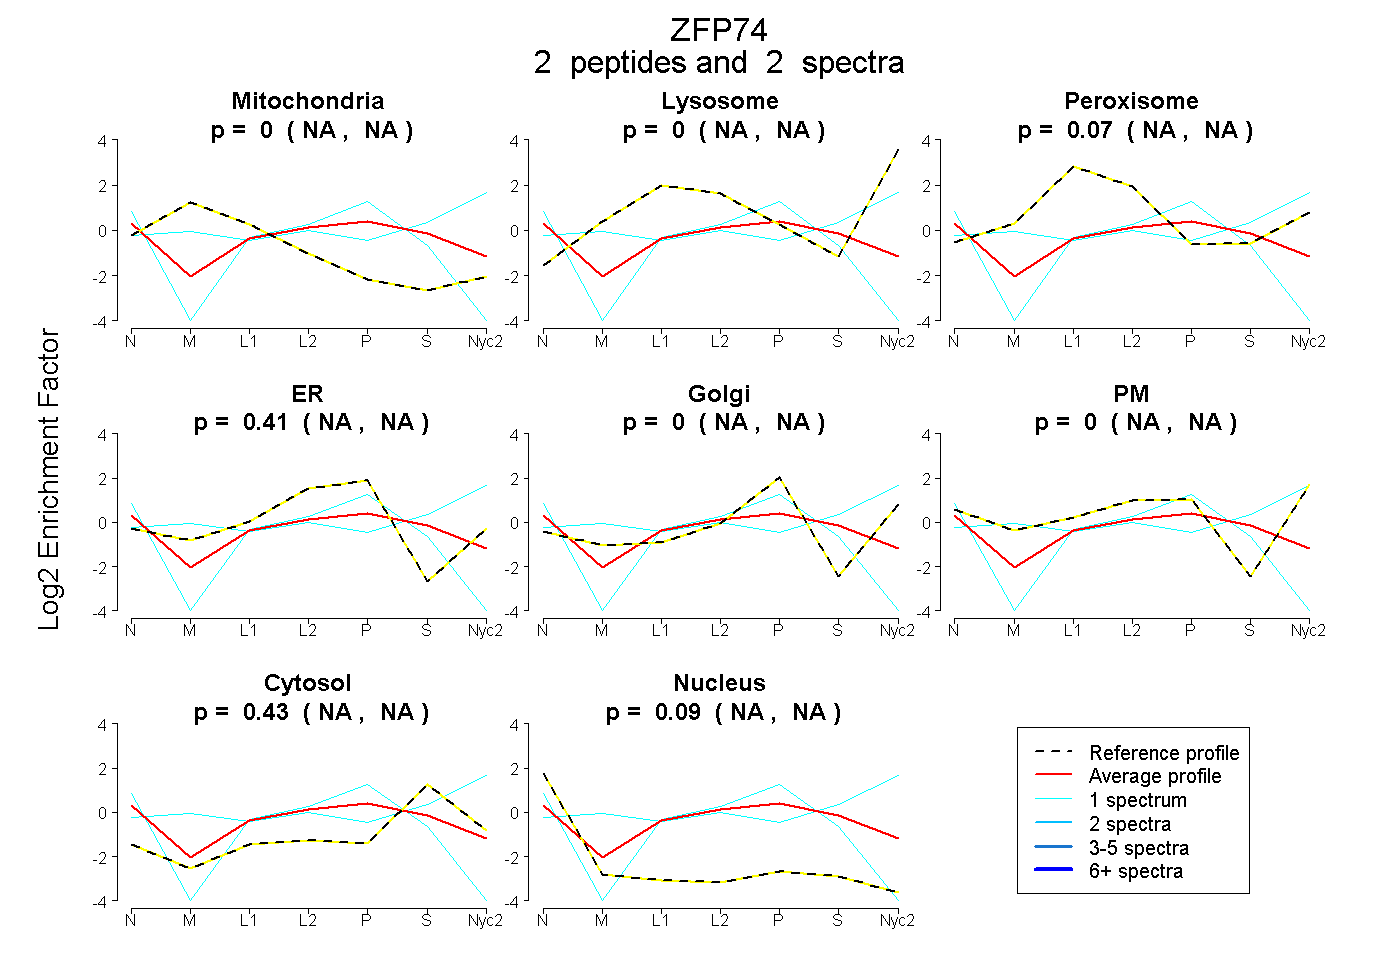
 2
2peptides
spectra
NA | NA
NA | NA
NA | NA
NA | NA
NA | NA
NA | NA
NA | NA
NA | NA
| Plot | Mito | Lyso | Perox | ER | Golgi | PM | Cytosol | Nucleus | |||||
| Expt A |
2 peptides |
2 spectra |
|
0.000 NA | NA |
0.000 NA | NA |
0.068 NA | NA |
0.414 NA | NA |
0.000 NA | NA |
0.000 NA | NA |
0.433 NA | NA |
0.085 NA | NA |
| 1 spectrum, IHTGEKPYLCK | 0.000 | 0.000 | 0.000 | 0.455 | 0.000 | 0.000 | 0.228 | 0.317 | ||
| 1 spectrum, QLDPTQR | 0.019 | 0.345 | 0.000 | 0.000 | 0.000 | 0.215 | 0.421 | 0.000 |