 2
2peptides
spectra
0.000 | 0.069
0.000 | 0.060
0.000 | 0.065
0.000 | 0.615
0.000 | 0.619
0.000 | 0.081
0.000 | 0.536
0.000 | 0.295
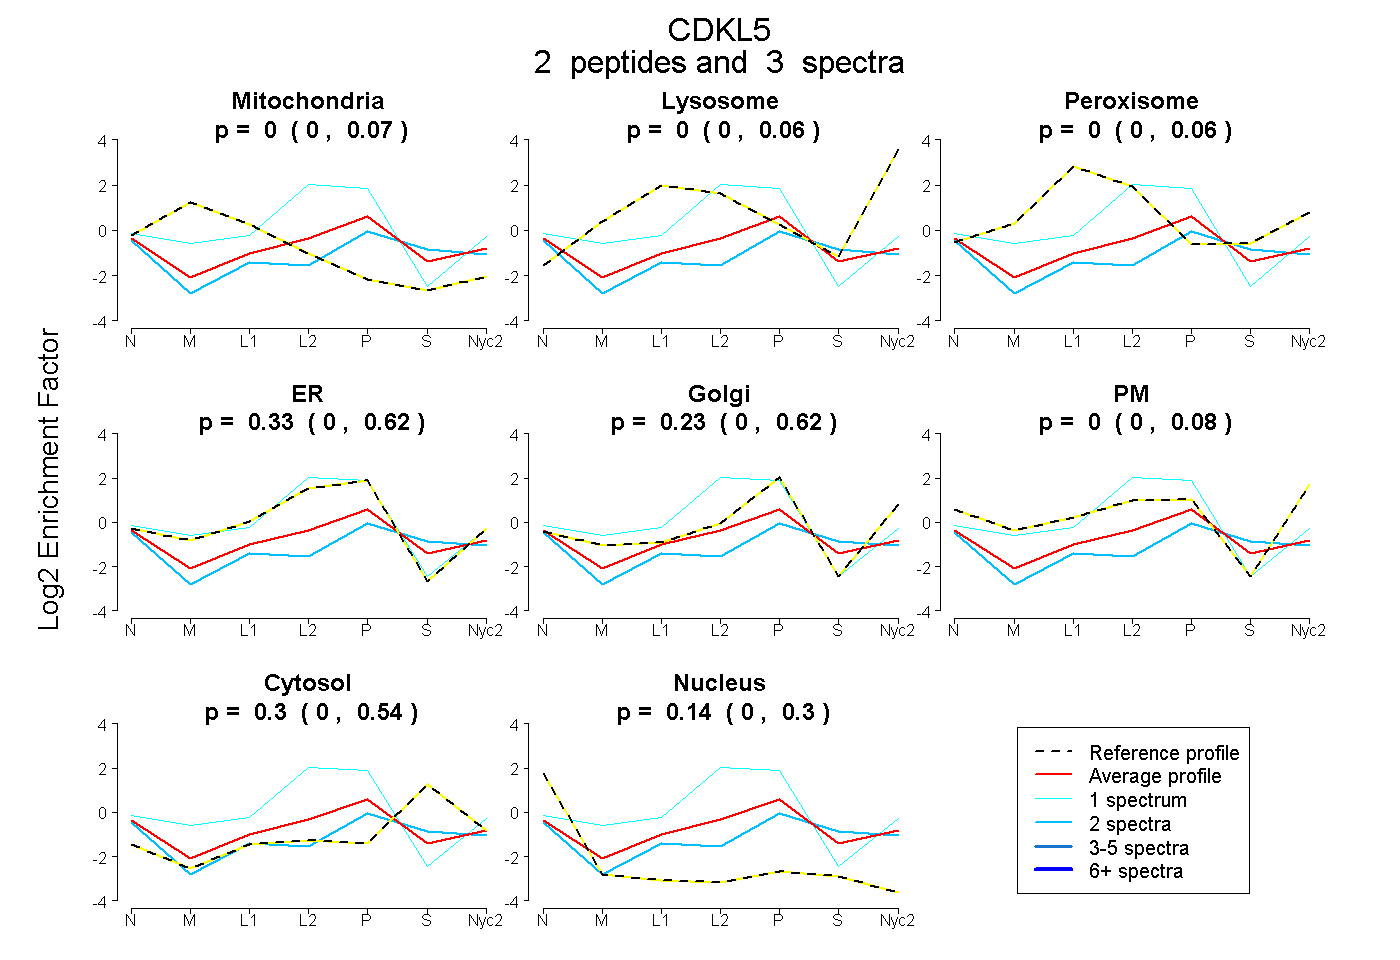
| Plot | Mito | Lyso | Perox | ER | Golgi | PM | Cytosol | Nucleus | |||||
| Expt A |
2 peptides |
3 spectra |
|
0.000 0.000 | 0.069 |
0.000 0.000 | 0.060 |
0.000 0.000 | 0.065 |
0.333 0.000 | 0.615 |
0.225 0.000 | 0.619 |
0.000 0.000 | 0.081 |
0.304 0.000 | 0.536 |
0.138 0.000 | 0.295 |
| 2 spectra, TLLSPSGR | 0.000 | 0.000 | 0.000 | 0.000 | 0.335 | 0.000 | 0.449 | 0.216 | ||
| 1 spectrum, FPAVNHPQSLER | 0.000 | 0.000 | 0.003 | 0.997 | 0.000 | 0.000 | 0.000 | 0.000 |