 3
3peptides
spectra
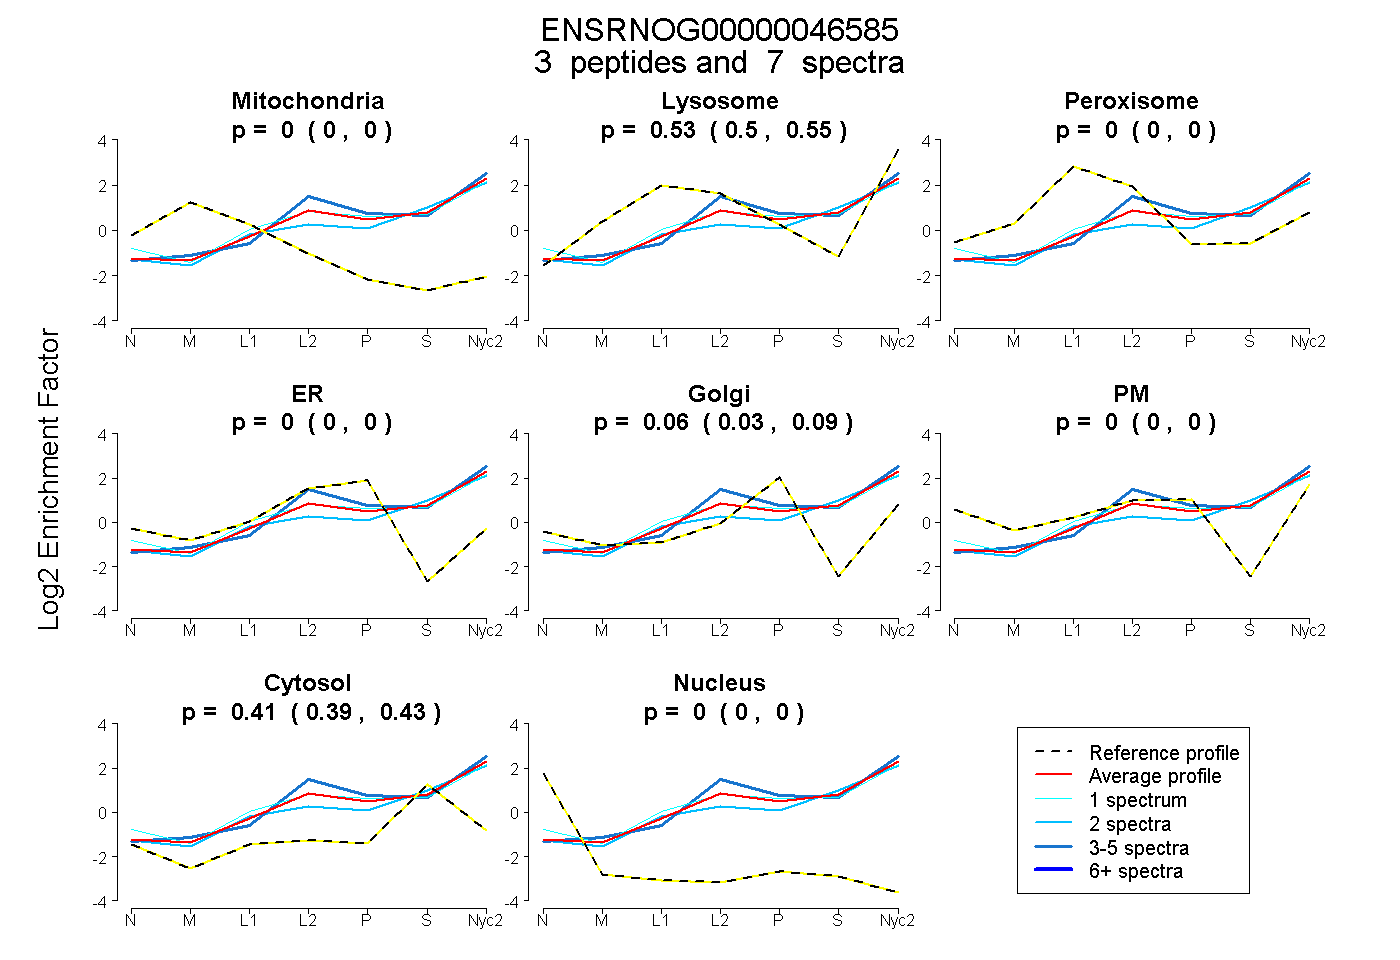
0.000 | 0.000
0.499 | 0.550
0.000 | 0.000
0.000 | 0.000
0.027 | 0.087
0.000 | 0.000
0.394 | 0.433
0.000 | 0.000
2peptides
spectra
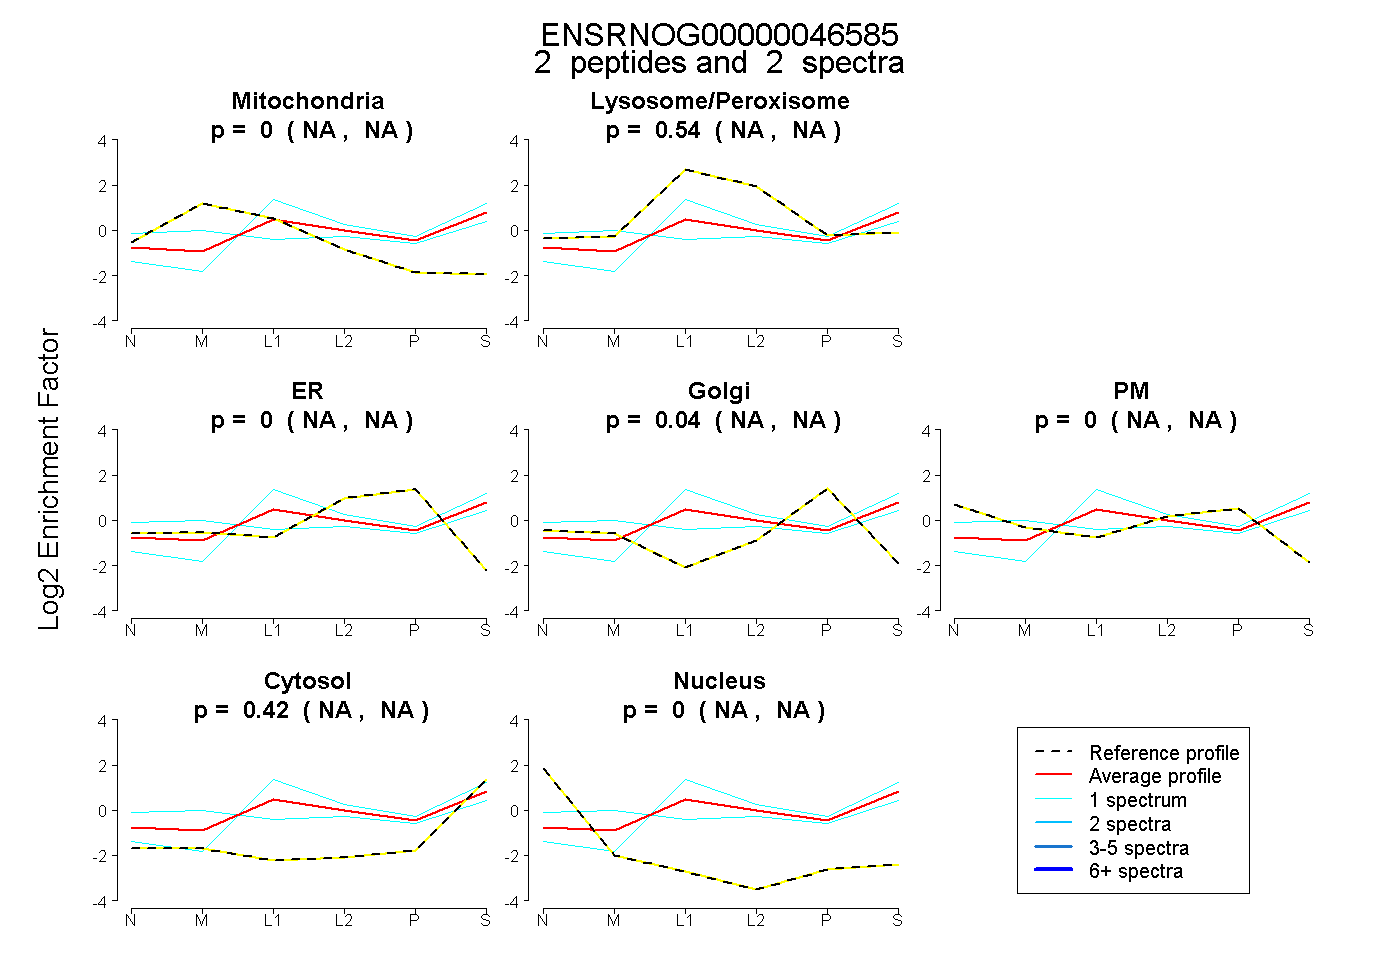
NA | NA
NA | NA
NA | NA
NA | NA
NA | NA
NA | NA
NA | NA
5peptides
spectra
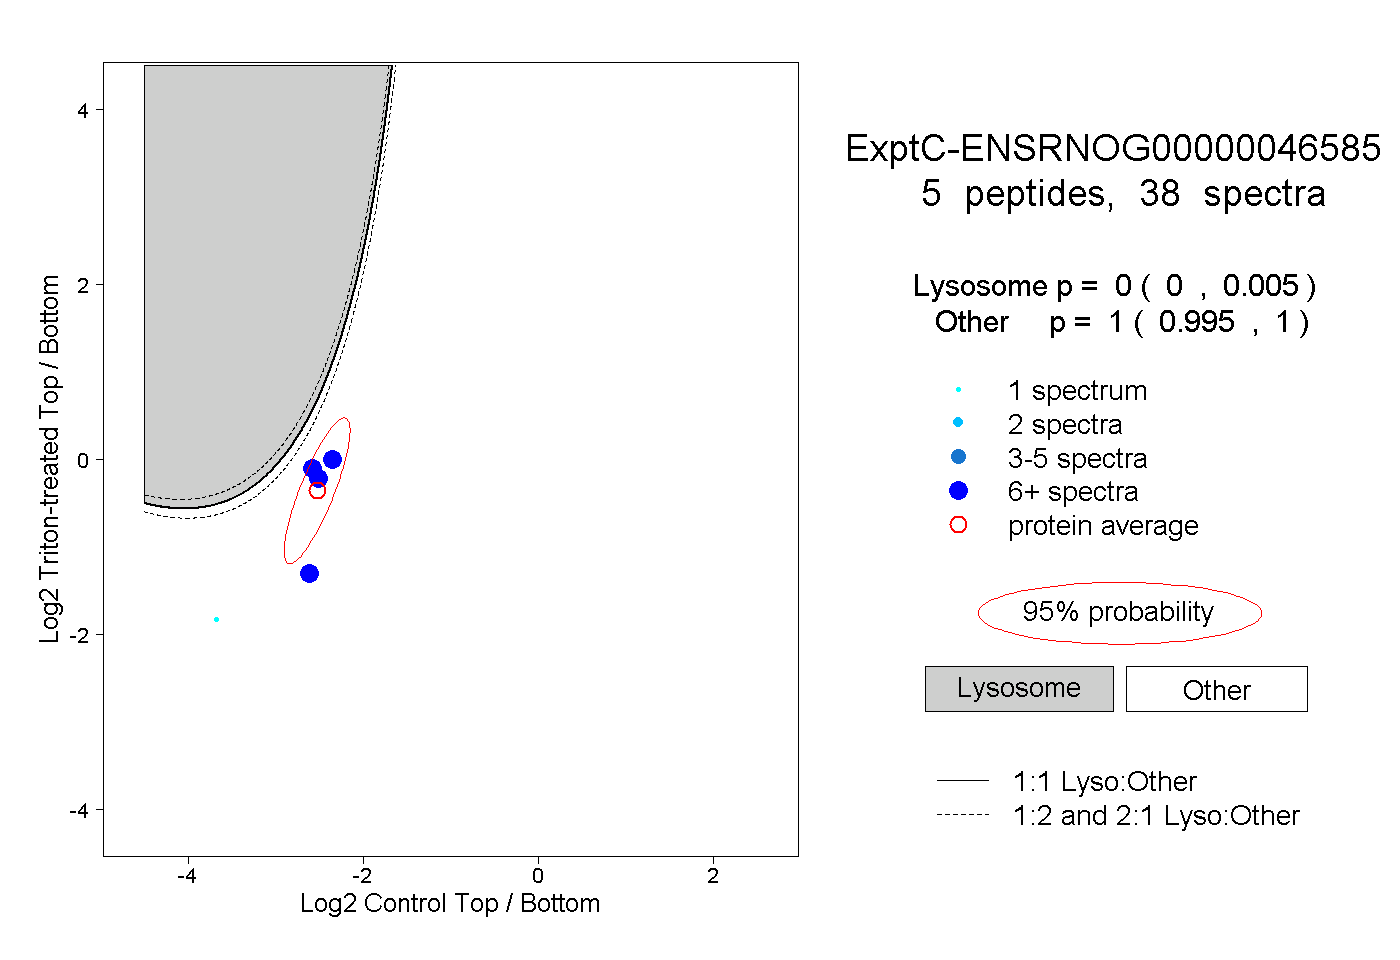
0.000 | 0.005
0.995 | 1.000
3peptides
spectra
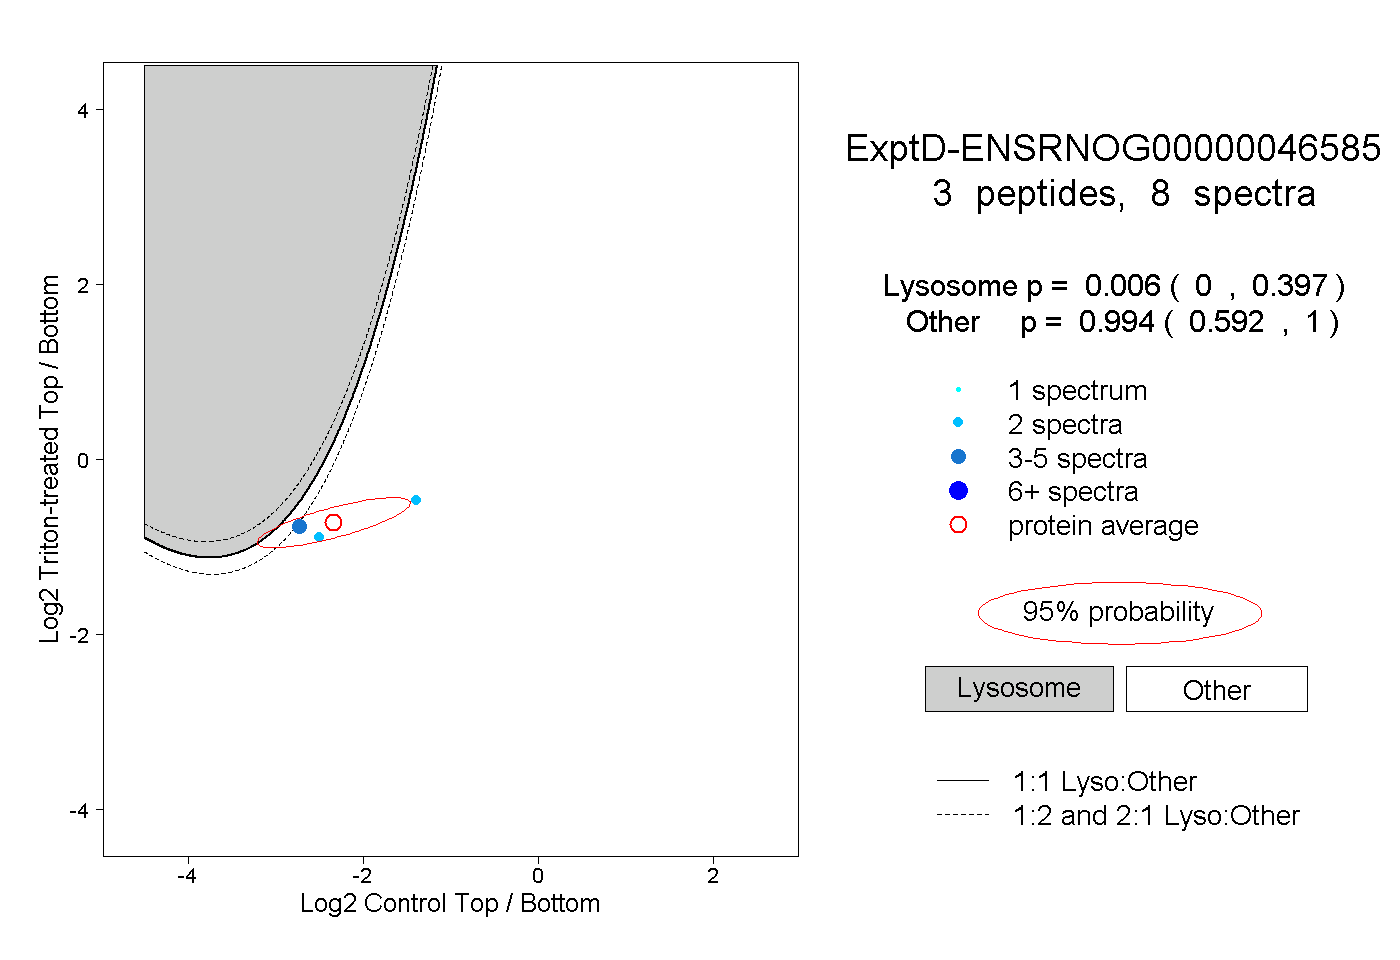
0.000 | 0.397
0.592 | 1.000