 6
6peptides
spectra
0.000 | 0.000
0.107 | 0.156
0.000 | 0.000
0.000 | 0.000
0.000 | 0.000
0.023 | 0.067
0.804 | 0.830
0.000 | 0.000
3peptides
spectra
0.000 | 0.000
1.000 | 1.000
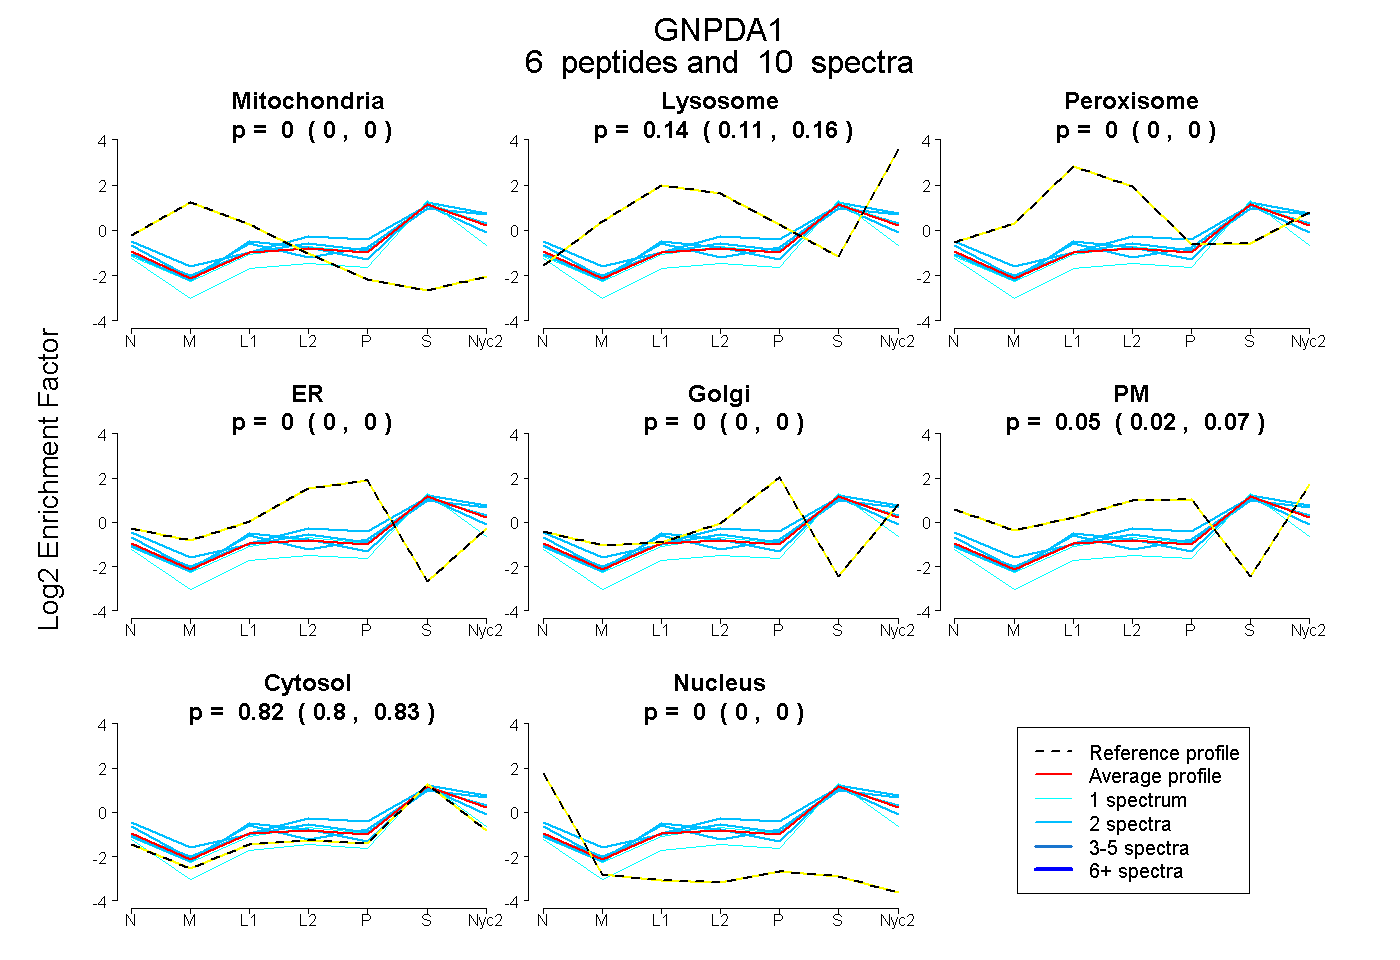
| Plot | Mito | Lyso | Perox | ER | Golgi | PM | Cytosol | Nucleus | |||||
| Expt A |
6 peptides |
10 spectra |
|
0.000 0.000 | 0.000 |
0.136 0.107 | 0.156 |
0.000 0.000 | 0.000 |
0.000 0.000 | 0.000 |
0.000 0.000 | 0.000 |
0.046 0.023 | 0.067 |
0.818 0.804 | 0.830 |
0.000 0.000 | 0.000 |
||
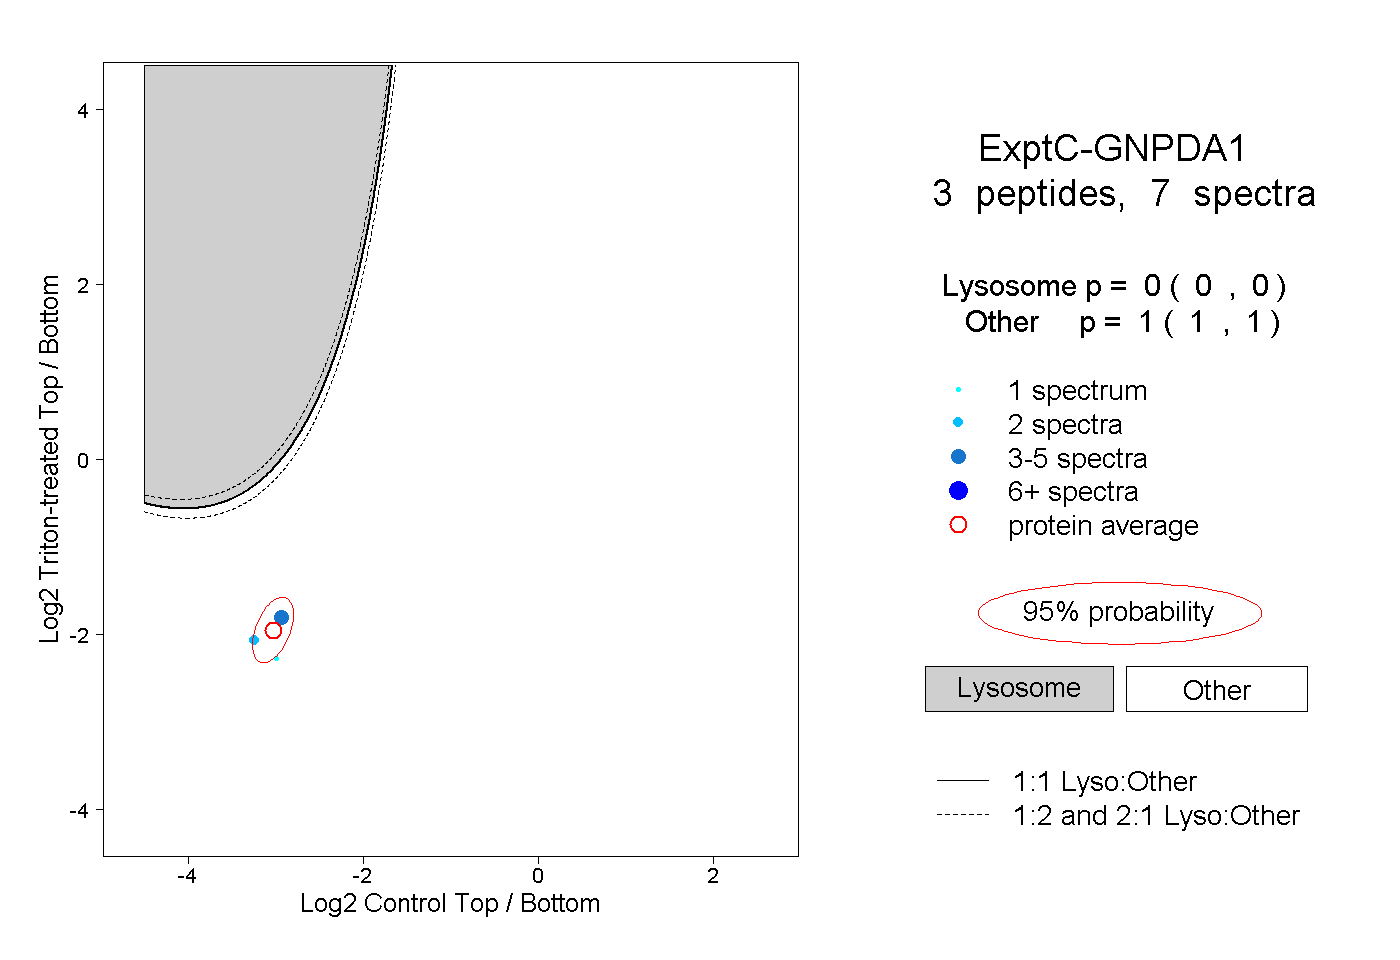
| Plot | Lyso | Other | |||||||||||
| Expt C |
3 peptides |
7 spectra |
|
0.000 0.000 | 0.000 |
1.000 1.000 | 1.000 |