 4
4peptides
spectra
0.000 | 0.000
0.000 | 0.000
0.000 | 0.000
0.000 | 0.039
0.000 | 0.018
0.000 | 0.000
0.637 | 0.683
0.270 | 0.342
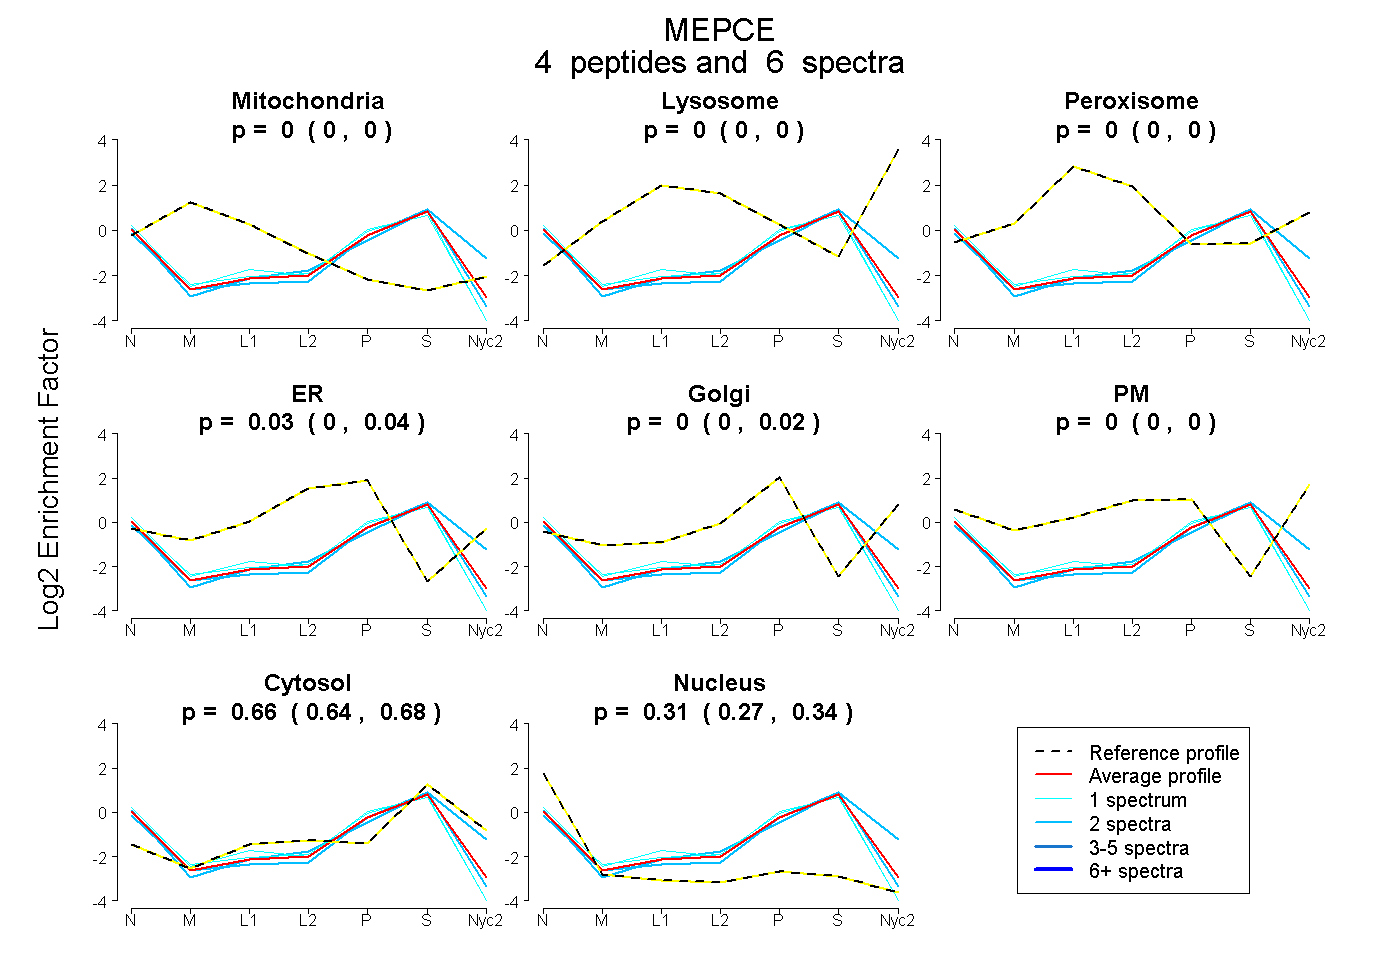
| Plot | Mito | Lyso | Perox | ER | Golgi | PM | Cytosol | Nucleus | |||||
| Expt A |
4 peptides |
6 spectra |
|
0.000 0.000 | 0.000 |
0.000 0.000 | 0.000 |
0.000 0.000 | 0.000 |
0.026 0.000 | 0.039 |
0.000 0.000 | 0.018 |
0.000 0.000 | 0.000 |
0.664 0.637 | 0.683 |
0.310 0.270 | 0.342 |
| 1 spectrum, VLKPEWFQGR | 0.000 | 0.000 | 0.000 | 0.039 | 0.000 | 0.000 | 0.595 | 0.366 | ||
| 2 spectra, SCFPASLTASR | 0.000 | 0.000 | 0.000 | 0.000 | 0.091 | 0.000 | 0.721 | 0.187 | ||
| 2 spectra, GFQRPVYLFHK | 0.000 | 0.000 | 0.000 | 0.000 | 0.000 | 0.000 | 0.666 | 0.334 | ||
| 1 spectrum, ILHSAR | 0.000 | 0.000 | 0.000 | 0.065 | 0.000 | 0.000 | 0.559 | 0.377 |