 1
1peptide
spectra
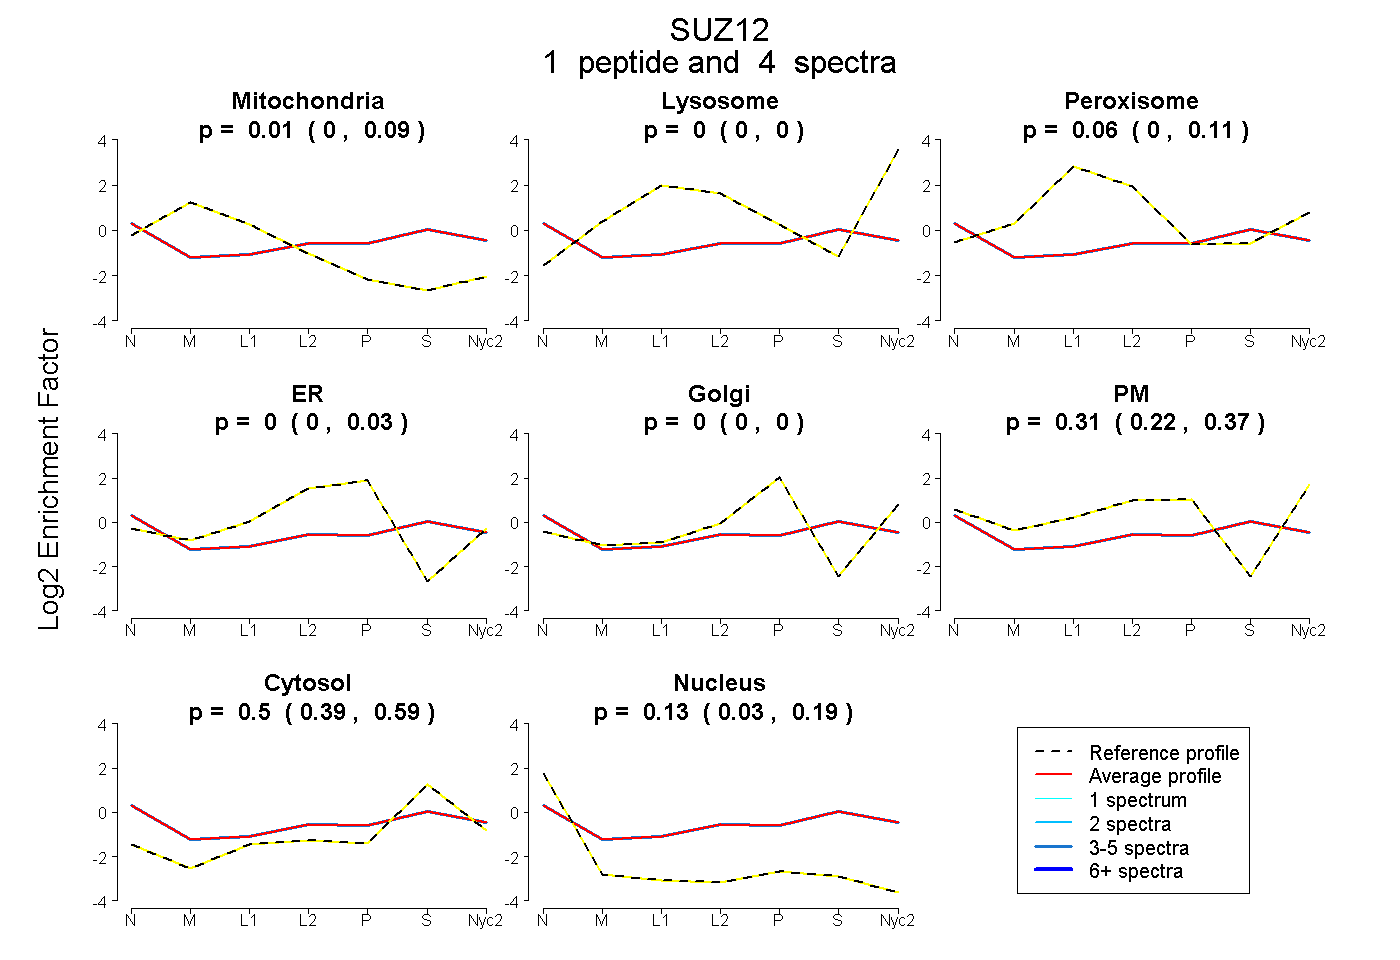
0.000 | 0.094
0.000 | 0.000
0.000 | 0.109
0.000 | 0.034
0.000 | 0.000
0.224 | 0.372
0.385 | 0.591
0.028 | 0.186
1peptide
spectrum
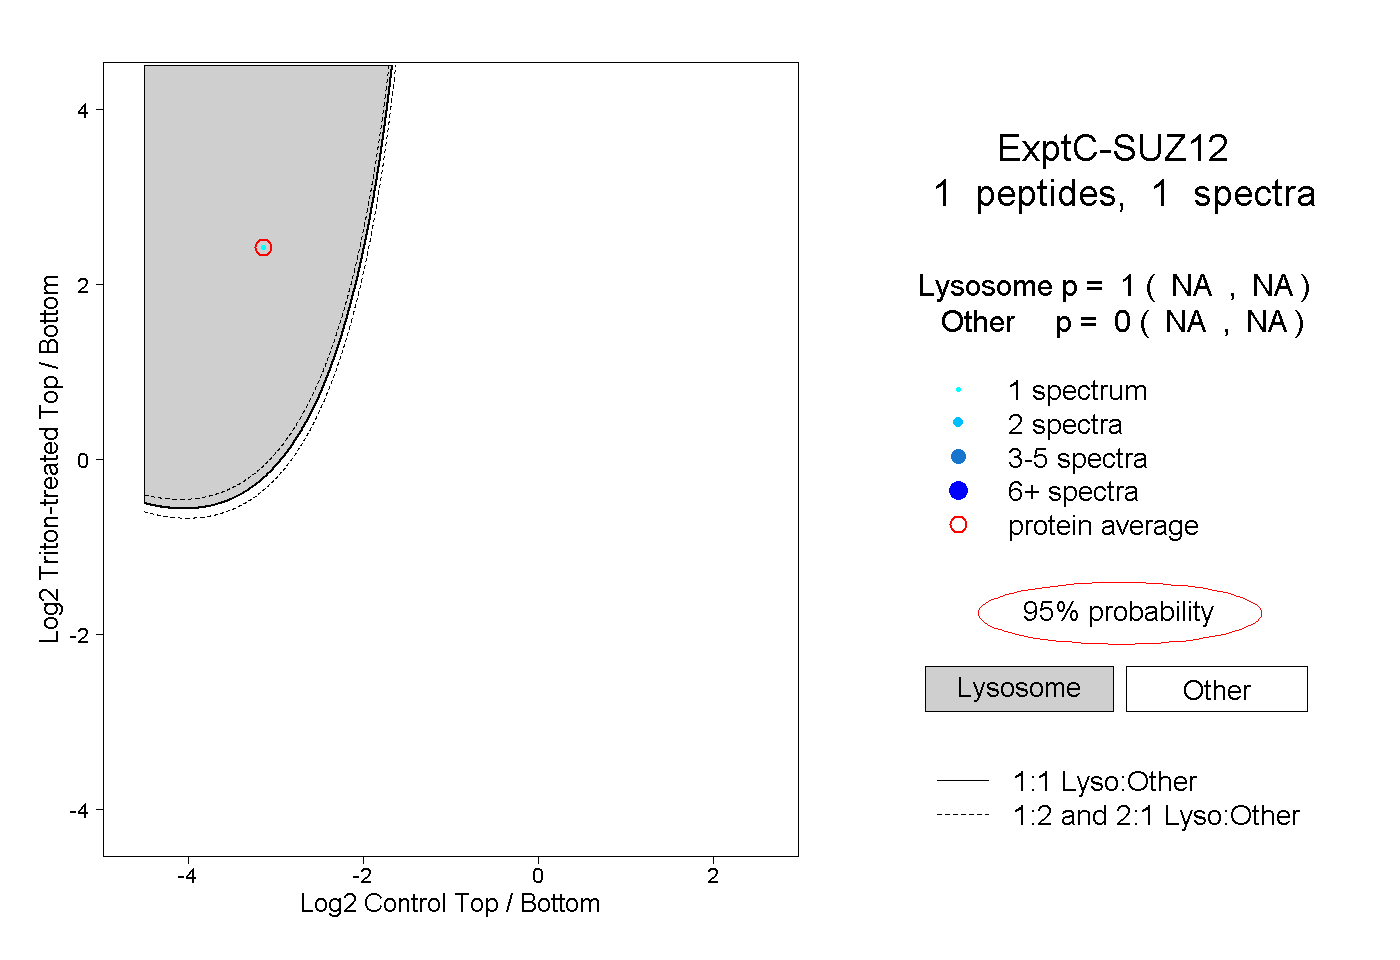
NA | NA
NA | NA
| Plot | Mito | Lyso | Perox | ER | Golgi | PM | Cytosol | Nucleus | |||||
| Expt A |
1 peptide |
4 spectra |
|
0.009 0.000 | 0.094 |
0.000 0.000 | 0.000 |
0.063 0.000 | 0.109 |
0.000 0.000 | 0.034 |
0.000 0.000 | 0.000 |
0.307 0.224 | 0.372 |
0.495 0.385 | 0.591 |
0.126 0.028 | 0.186 |
||
| Plot | Lyso | Other | |||||||||||
| Expt C |
1 peptide |
1 spectrum |
|
1.000 NA | NA |
0.000 NA | NA |