 20
20peptides
spectra
0.064 | 0.071
0.000 | 0.000
0.000 | 0.000
0.010 | 0.031
0.108 | 0.125
0.750 | 0.768
0.000 | 0.000
0.031 | 0.036
| Plot | Mito | Lyso | Perox | ER | Golgi | PM | Cytosol | Nucleus | |||||
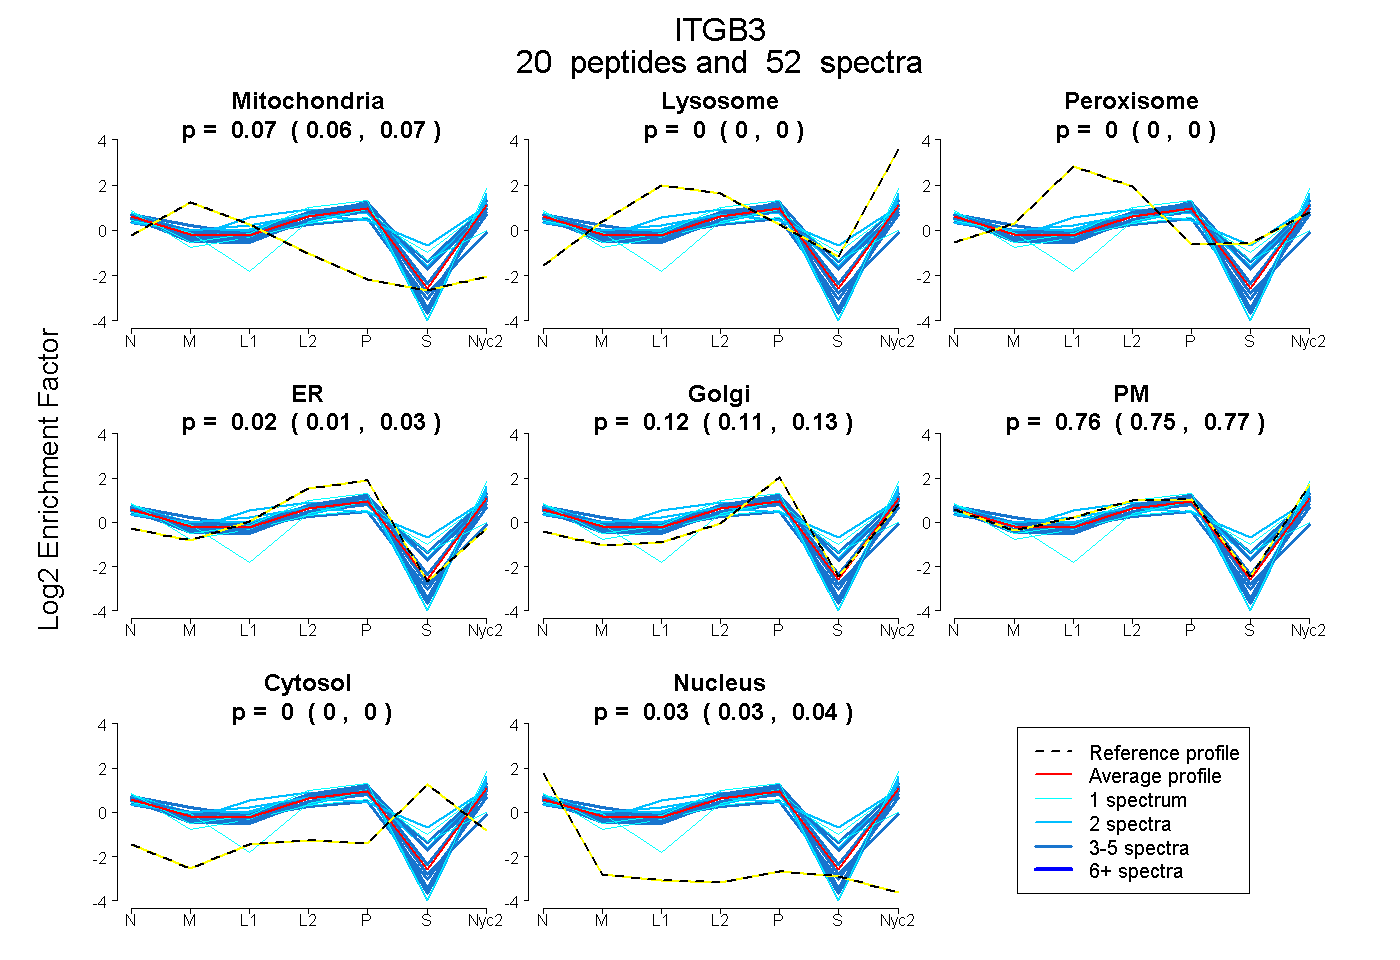
| Expt A |
20 peptides |
52 spectra |
|
0.068 0.064 | 0.071 |
0.000 0.000 | 0.000 |
0.000 0.000 | 0.000 |
0.022 0.010 | 0.031 |
0.117 0.108 | 0.125 |
0.760 0.750 | 0.768 |
0.000 0.000 | 0.000 |
0.034 0.031 | 0.036 |
| 1 spectrum, DDLSSIQTLGTK | 0.004 | 0.000 | 0.000 | 0.000 | 0.007 | 0.938 | 0.000 | 0.050 | ||
| 1 spectrum, LTSNLR | 0.000 | 0.000 | 0.000 | 0.000 | 0.000 | 0.739 | 0.247 | 0.014 | ||
| 4 spectra, IFSLQVR | 0.000 | 0.000 | 0.000 | 0.090 | 0.153 | 0.647 | 0.102 | 0.008 | ||
| 1 spectrum, WDTANNPLYK | 0.000 | 0.000 | 0.000 | 0.000 | 0.063 | 0.936 | 0.000 | 0.001 | ||
| 4 spectra, GCGAPQK | 0.064 | 0.000 | 0.000 | 0.041 | 0.227 | 0.648 | 0.000 | 0.019 | ||
| 1 spectrum, YCECDDFSCVR | 0.058 | 0.000 | 0.000 | 0.117 | 0.353 | 0.258 | 0.138 | 0.075 | ||
| 4 spectra, EGQPICSQR | 0.036 | 0.000 | 0.000 | 0.045 | 0.061 | 0.829 | 0.000 | 0.028 | ||
| 4 spectra, NEDDCVVR | 0.132 | 0.000 | 0.000 | 0.403 | 0.000 | 0.392 | 0.000 | 0.073 | ||
| 4 spectra, IGDTVSFSIEAK | 0.021 | 0.000 | 0.021 | 0.010 | 0.009 | 0.777 | 0.162 | 0.000 | ||
| 3 spectra, STCLPMFGYK | 0.043 | 0.000 | 0.000 | 0.091 | 0.128 | 0.702 | 0.000 | 0.037 | ||
| 2 spectra, THIALDGR | 0.000 | 0.000 | 0.225 | 0.000 | 0.000 | 0.578 | 0.197 | 0.000 | ||
| 2 spectra, LAGIVLPNDGR | 0.000 | 0.000 | 0.000 | 0.000 | 0.034 | 0.933 | 0.000 | 0.033 | ||
| 3 spectra, AVLYVVEEPECPK | 0.207 | 0.000 | 0.000 | 0.000 | 0.046 | 0.710 | 0.000 | 0.037 | ||
| 4 spectra, DAPEGGFDAIMQATVCDEK | 0.006 | 0.000 | 0.000 | 0.045 | 0.065 | 0.699 | 0.139 | 0.045 | ||
| 2 spectra, GCPQQK | 0.001 | 0.000 | 0.040 | 0.000 | 0.000 | 0.834 | 0.112 | 0.013 | ||
| 2 spectra, FQYYEDSSGR | 0.068 | 0.000 | 0.000 | 0.000 | 0.028 | 0.882 | 0.000 | 0.022 | ||
| 2 spectra, LRPDDSK | 0.004 | 0.000 | 0.000 | 0.015 | 0.083 | 0.868 | 0.000 | 0.030 | ||
| 2 spectra, HVLTLTDQVTR | 0.038 | 0.000 | 0.084 | 0.045 | 0.000 | 0.816 | 0.000 | 0.017 | ||
| 4 spectra, NPCYTMK | 0.069 | 0.000 | 0.000 | 0.119 | 0.087 | 0.725 | 0.000 | 0.000 | ||
| 2 spectra, GSGDSAQITQVSPQR | 0.000 | 0.000 | 0.055 | 0.000 | 0.000 | 0.830 | 0.100 | 0.015 |
| Plot | Mito | Lyso or Perox | ER | Golgi | PM | Cytosol | Nucleus | ||||||
| Expt B |
9 peptides |
13 spectra |
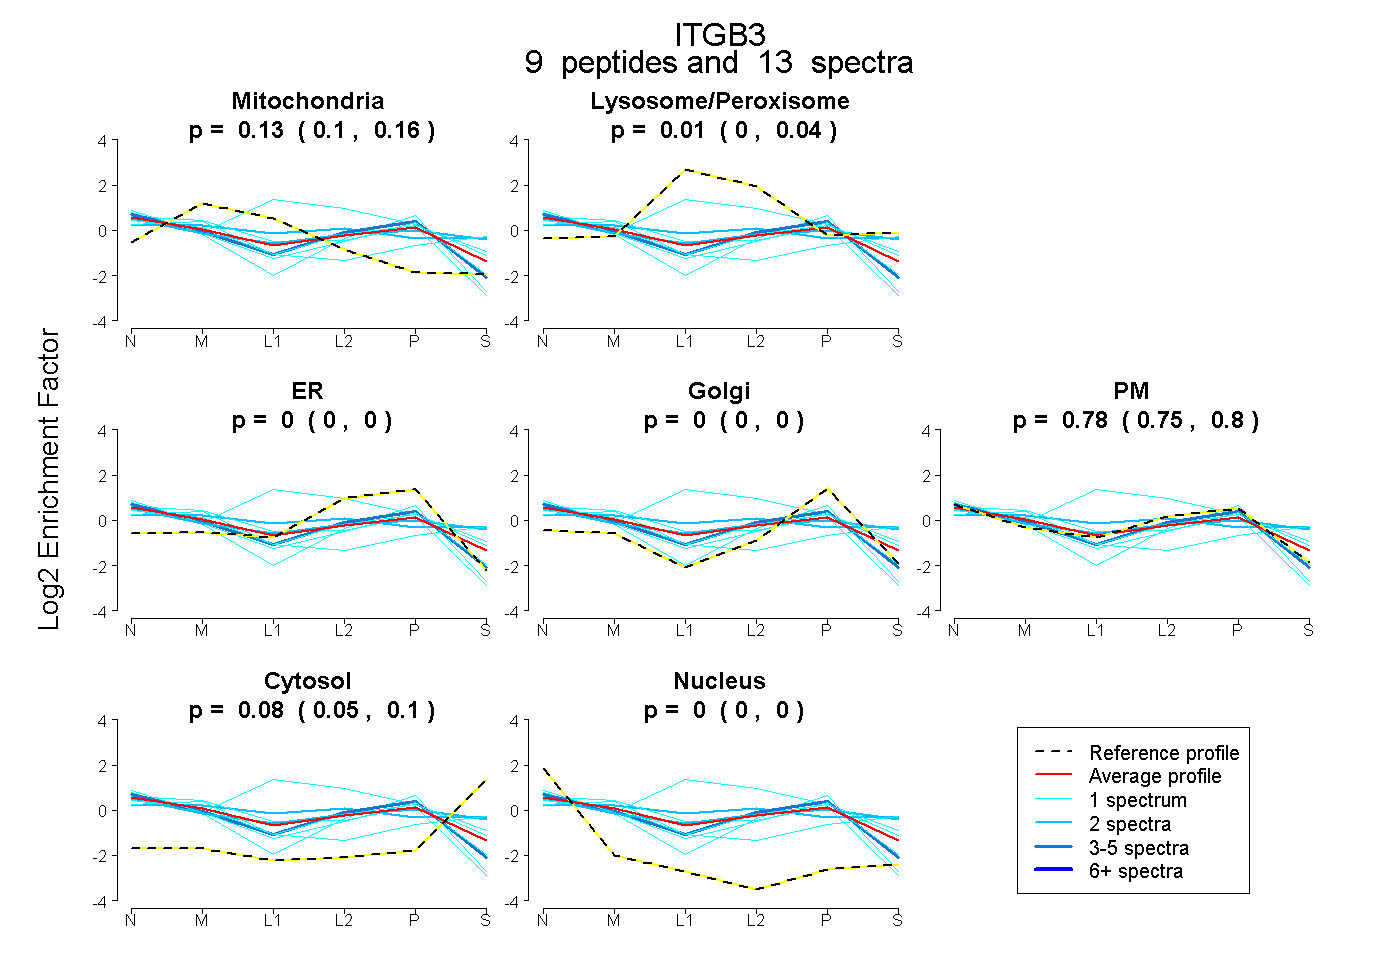 |
0.133 0.097 | 0.159 |
0.010 0.000 | 0.039 |
0.000 0.000 | 0.000 |
0.000 0.000 | 0.000 |
0.782 0.746 | 0.804 |
0.075 0.046 | 0.098 |
0.000 0.000 | 0.004 |
|||
| Plot | Lyso | Other | |||||||||||
| Expt C |
21 peptides |
94 spectra |
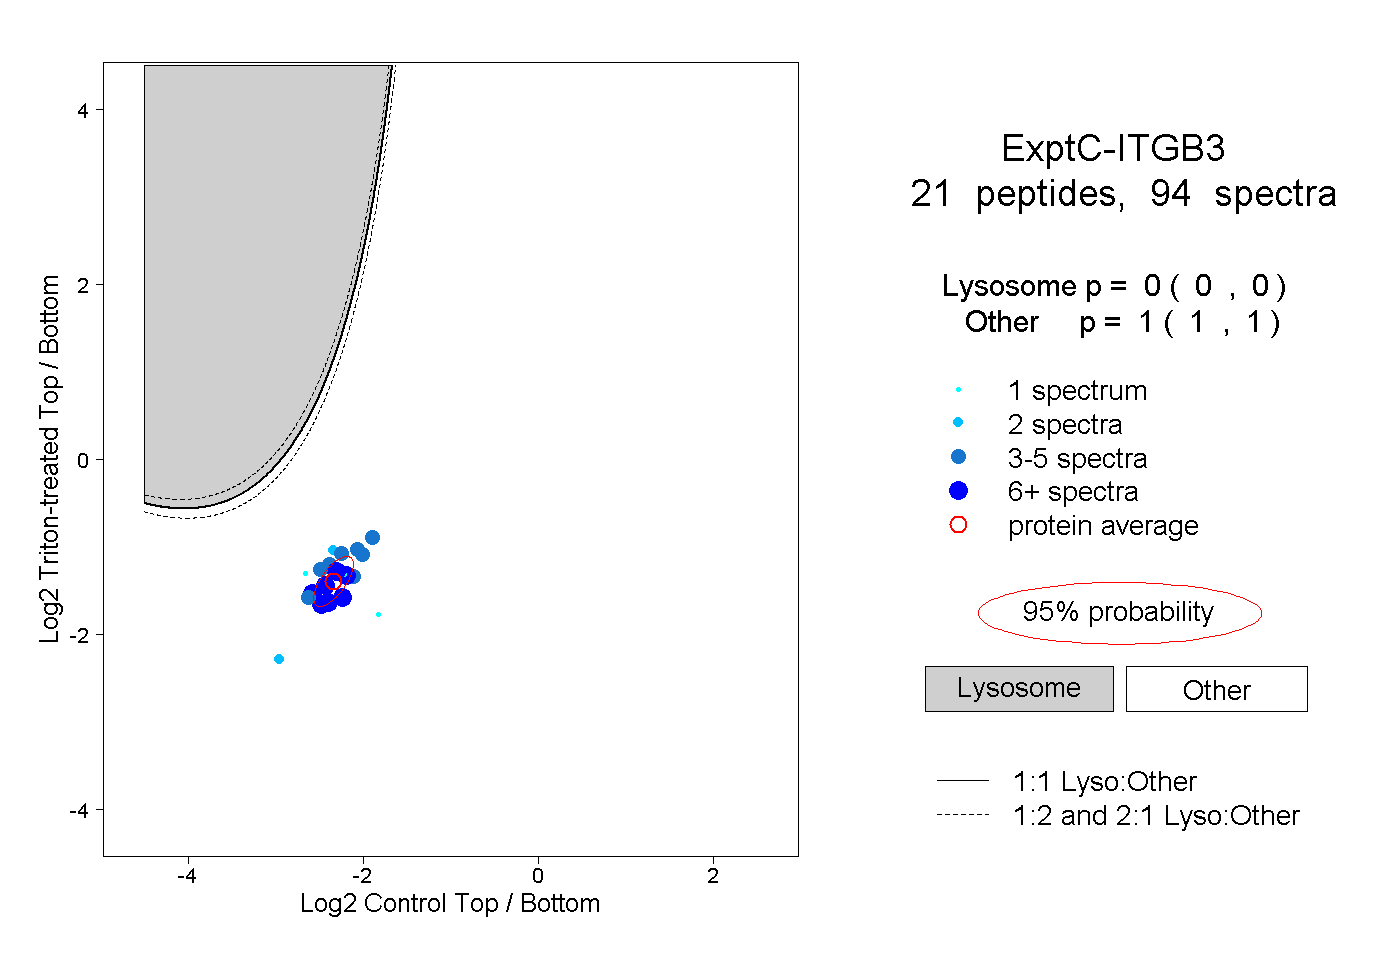 |
0.000 0.000 | 0.000 |
1.000 1.000 | 1.000 |
||||||||
| Plot | Lyso | Other | |||||||||||
| Expt D |
6 peptides |
13 spectra |
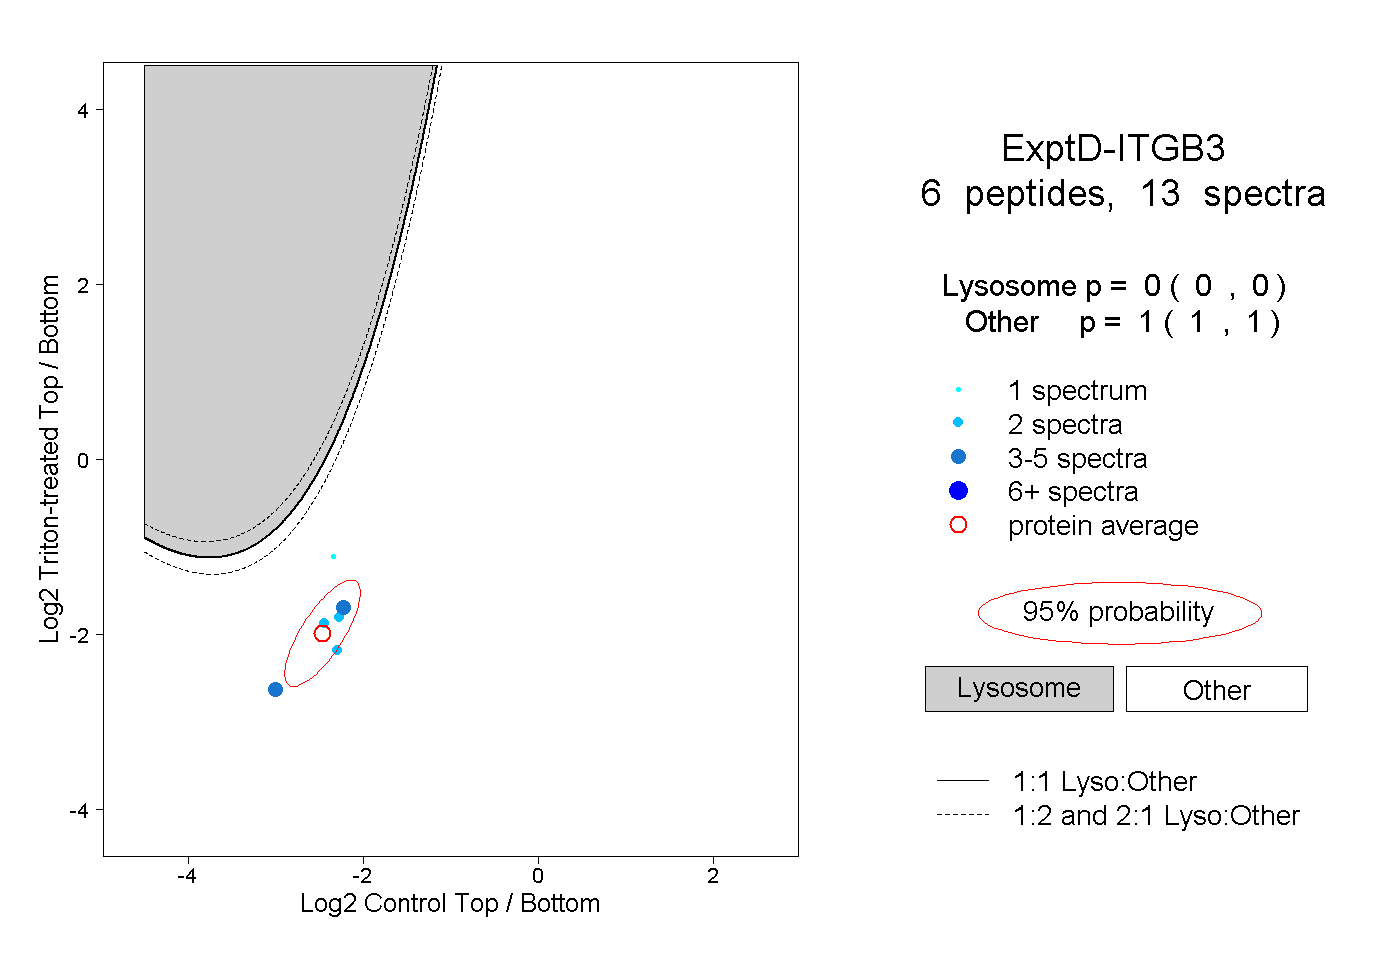 |
0.000 0.000 | 0.000 |
1.000 1.000 | 1.000 |