 5
5peptides
spectra
0.000 | 0.000
0.027 | 0.149
0.000 | 0.052
0.000 | 0.000
0.000 | 0.000
0.079 | 0.152
0.743 | 0.793
0.000 | 0.000
1peptide
spectra
NA | NA
NA | NA
| Plot | Mito | Lyso | Perox | ER | Golgi | PM | Cytosol | Nucleus | |||||
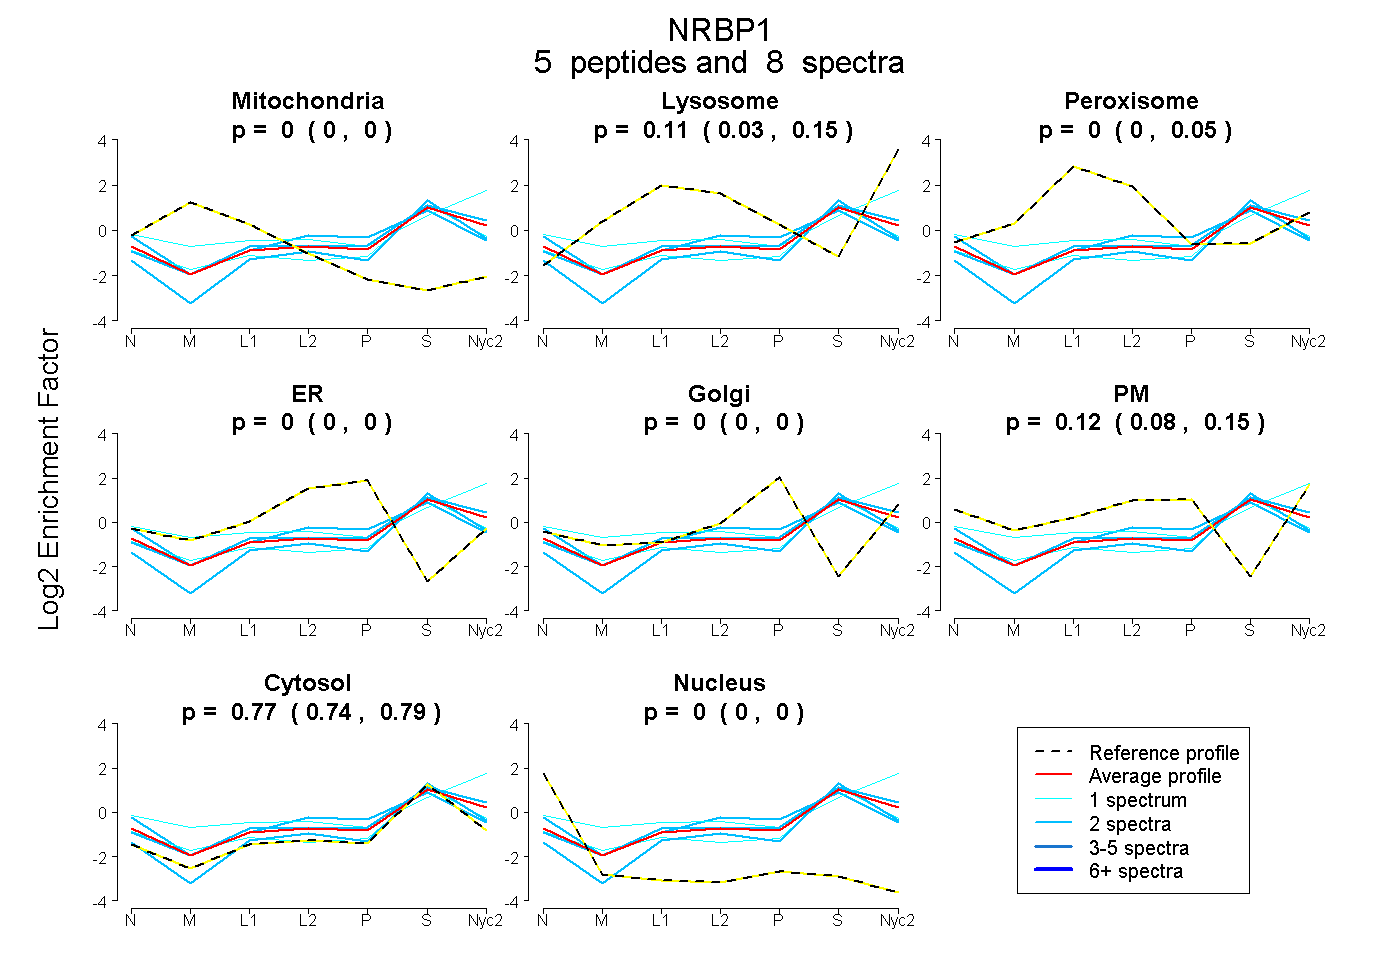
| Expt A |
5 peptides |
8 spectra |
|
0.000 0.000 | 0.000 |
0.109 0.027 | 0.149 |
0.000 0.000 | 0.052 |
0.000 0.000 | 0.000 |
0.000 0.000 | 0.000 |
0.121 0.079 | 0.152 |
0.770 0.743 | 0.793 |
0.000 0.000 | 0.000 |
||
| Plot | Lyso | Other | |||||||||||
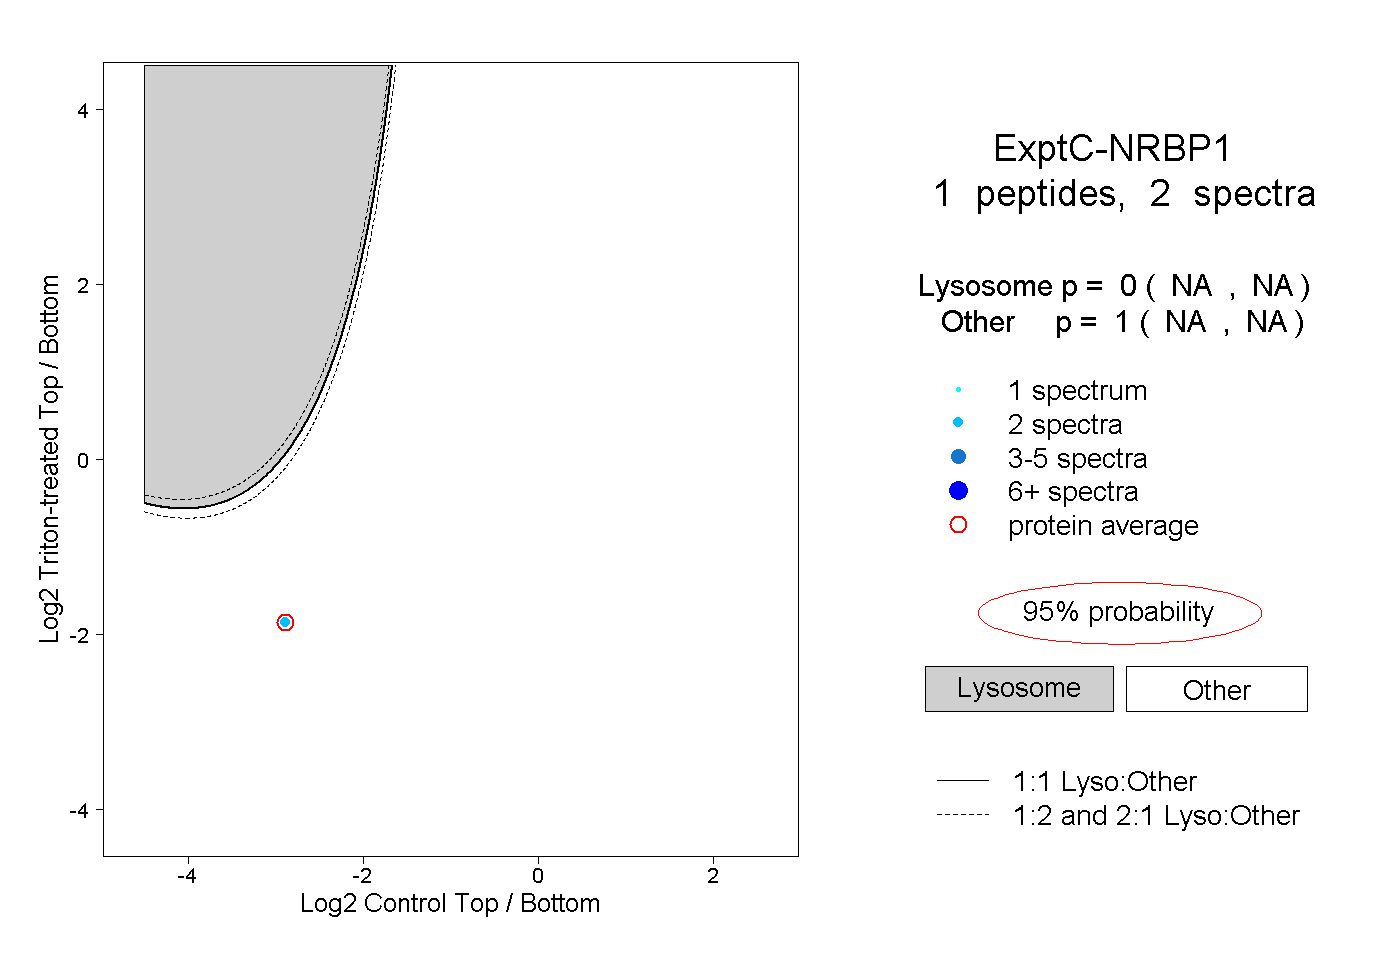
| Expt C |
1 peptide |
2 spectra |
|
0.000 NA | NA |
1.000 NA | NA |
| 2 spectra, TPTPEPAEVETR | 0.000 | 1.000 |