 18
18peptides
spectra
0.000 | 0.000
0.028 | 0.040
0.000 | 0.000
0.089 | 0.107
0.059 | 0.083
0.792 | 0.797
0.000 | 0.000
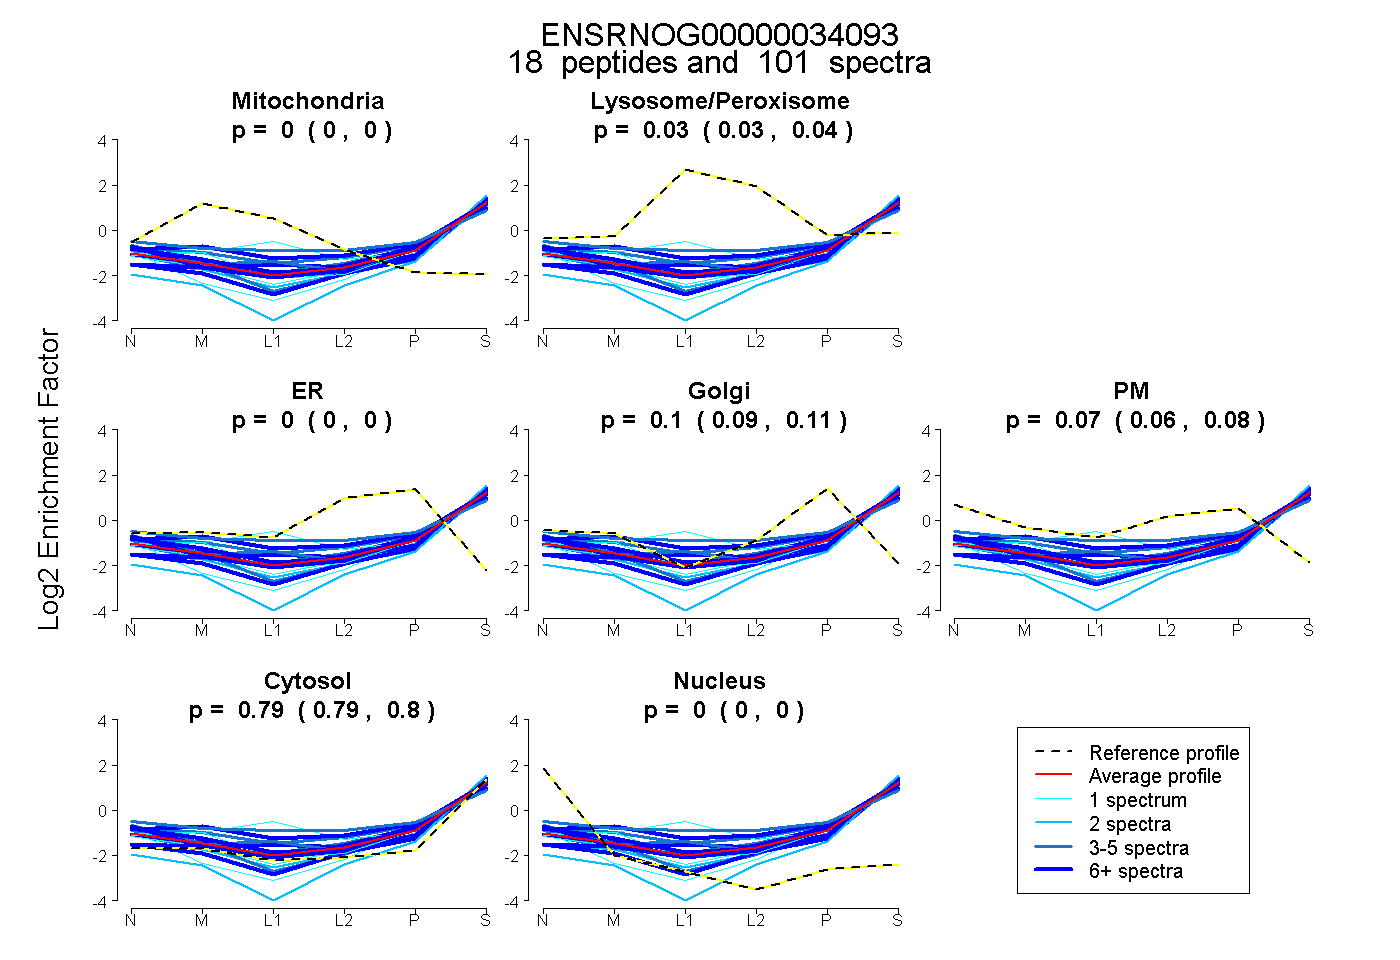
| Plot | Mito | Lyso or Perox | ER | Golgi | PM | Cytosol | Nucleus | ||||||
| Expt B |
18 peptides |
101 spectra |
|
0.000 0.000 | 0.000 |
0.035 0.028 | 0.040 |
0.000 0.000 | 0.000 |
0.099 0.089 | 0.107 |
0.072 0.059 | 0.083 |
0.795 0.792 | 0.797 |
0.000 0.000 | 0.000 |
| 11 spectra, SQIHDIVLVGGSTR | 0.000 | 0.188 | 0.000 | 0.136 | 0.062 | 0.614 | 0.000 | |||
| 1 spectrum, SINPDEAVAYGAAVQAAILSGDK | 0.000 | 0.000 | 0.000 | 0.119 | 0.087 | 0.795 | 0.000 | |||
| 21 spectra, STAGDTHLGGEDFDNR | 0.000 | 0.019 | 0.000 | 0.022 | 0.191 | 0.768 | 0.000 | |||
| 5 spectra, LLQDFFNGK | 0.000 | 0.128 | 0.000 | 0.104 | 0.000 | 0.752 | 0.016 | |||
| 11 spectra, HWPFMVVNDAGRPK | 0.000 | 0.125 | 0.000 | 0.026 | 0.000 | 0.849 | 0.000 | |||
| 1 spectrum, NQVAMNPTNTVFDAK | 0.000 | 0.304 | 0.000 | 0.015 | 0.000 | 0.682 | 0.000 | |||
| 3 spectra, VQVEYK | 0.000 | 0.203 | 0.000 | 0.002 | 0.230 | 0.565 | 0.000 | |||
| 3 spectra, FDDAVVQSDMK | 0.000 | 0.080 | 0.000 | 0.140 | 0.000 | 0.780 | 0.000 | |||
| 2 spectra, NSLESYAFNMK | 0.000 | 0.000 | 0.000 | 0.000 | 0.000 | 1.000 | 0.000 | |||
| 1 spectrum, FELTGIPPAPR | 0.000 | 0.000 | 0.000 | 0.113 | 0.026 | 0.861 | 0.000 | |||
| 2 spectra, CNEIISWLDK | 0.000 | 0.000 | 0.000 | 0.112 | 0.000 | 0.888 | 0.000 | |||
| 7 spectra, MVNHFIAEFK | 0.000 | 0.000 | 0.000 | 0.069 | 0.000 | 0.931 | 0.000 | |||
| 5 spectra, DAGTIAGLNVLR | 0.000 | 0.118 | 0.000 | 0.056 | 0.164 | 0.663 | 0.000 | |||
| 2 spectra, GPAVGIDLGTTYSCVGVFQHGK | 0.000 | 0.015 | 0.000 | 0.000 | 0.105 | 0.835 | 0.045 | |||
| 6 spectra, TTPSYVAFTDTER | 0.000 | 0.000 | 0.000 | 0.096 | 0.130 | 0.774 | 0.000 | |||
| 14 spectra, FEELNADLFR | 0.000 | 0.048 | 0.000 | 0.177 | 0.003 | 0.772 | 0.000 | |||
| 5 spectra, GTLDPVEK | 0.000 | 0.000 | 0.000 | 0.203 | 0.000 | 0.753 | 0.044 | |||
| 1 spectrum, EIAEAYLGK | 0.000 | 0.000 | 0.000 | 0.109 | 0.000 | 0.838 | 0.053 |
| Plot | Lyso | Other | |||||||||||
| Expt C |
24 peptides |
447 spectra |
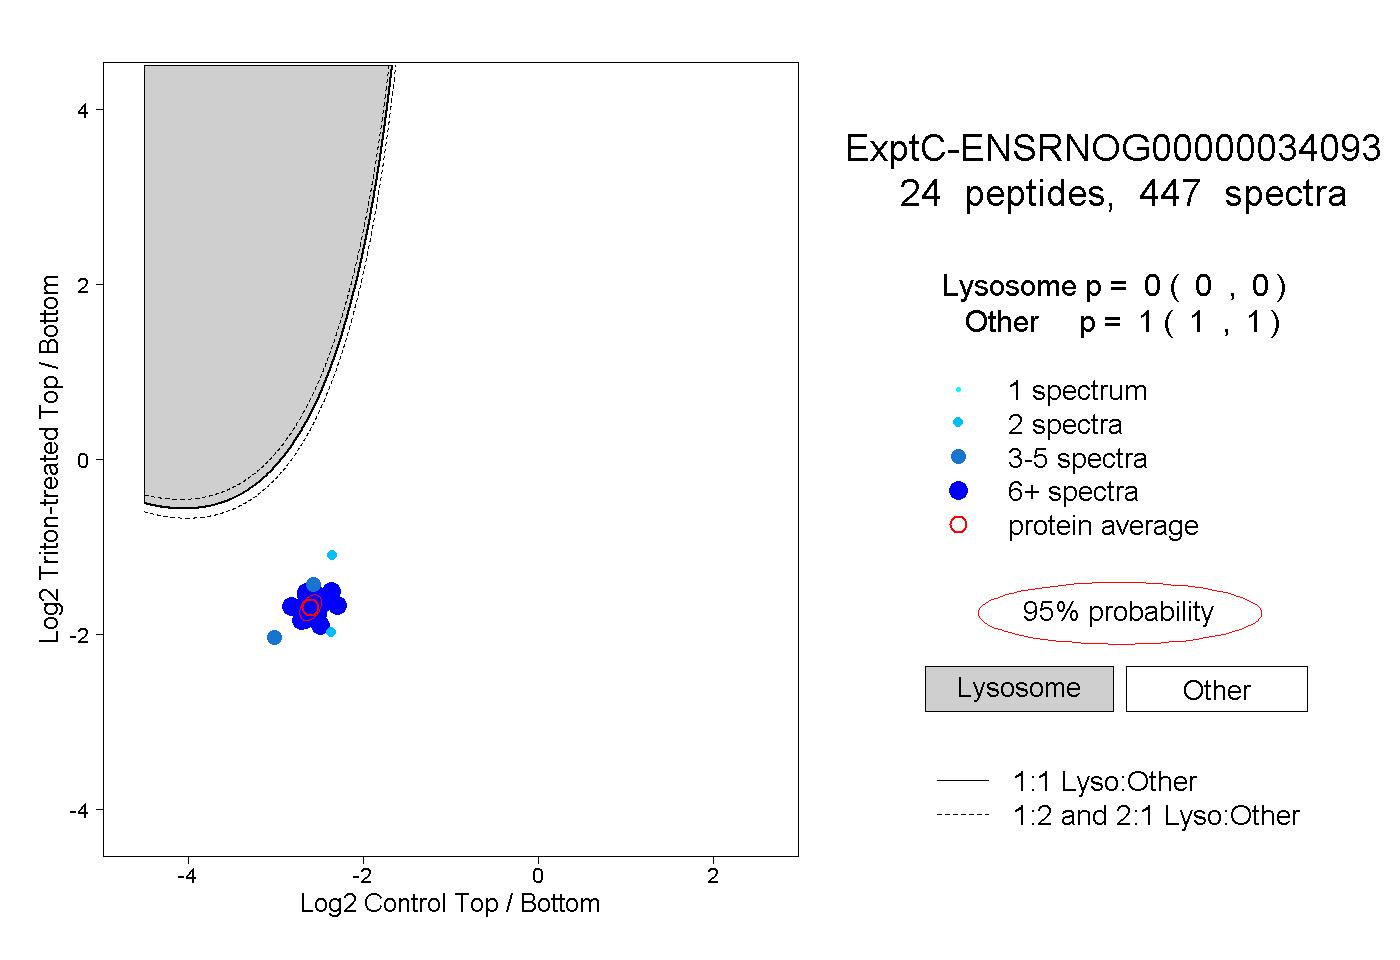 |
0.000 0.000 | 0.000 |
1.000 1.000 | 1.000 |
||||||||
| Plot | Lyso | Other | |||||||||||
| Expt D |
9 peptides |
23 spectra |
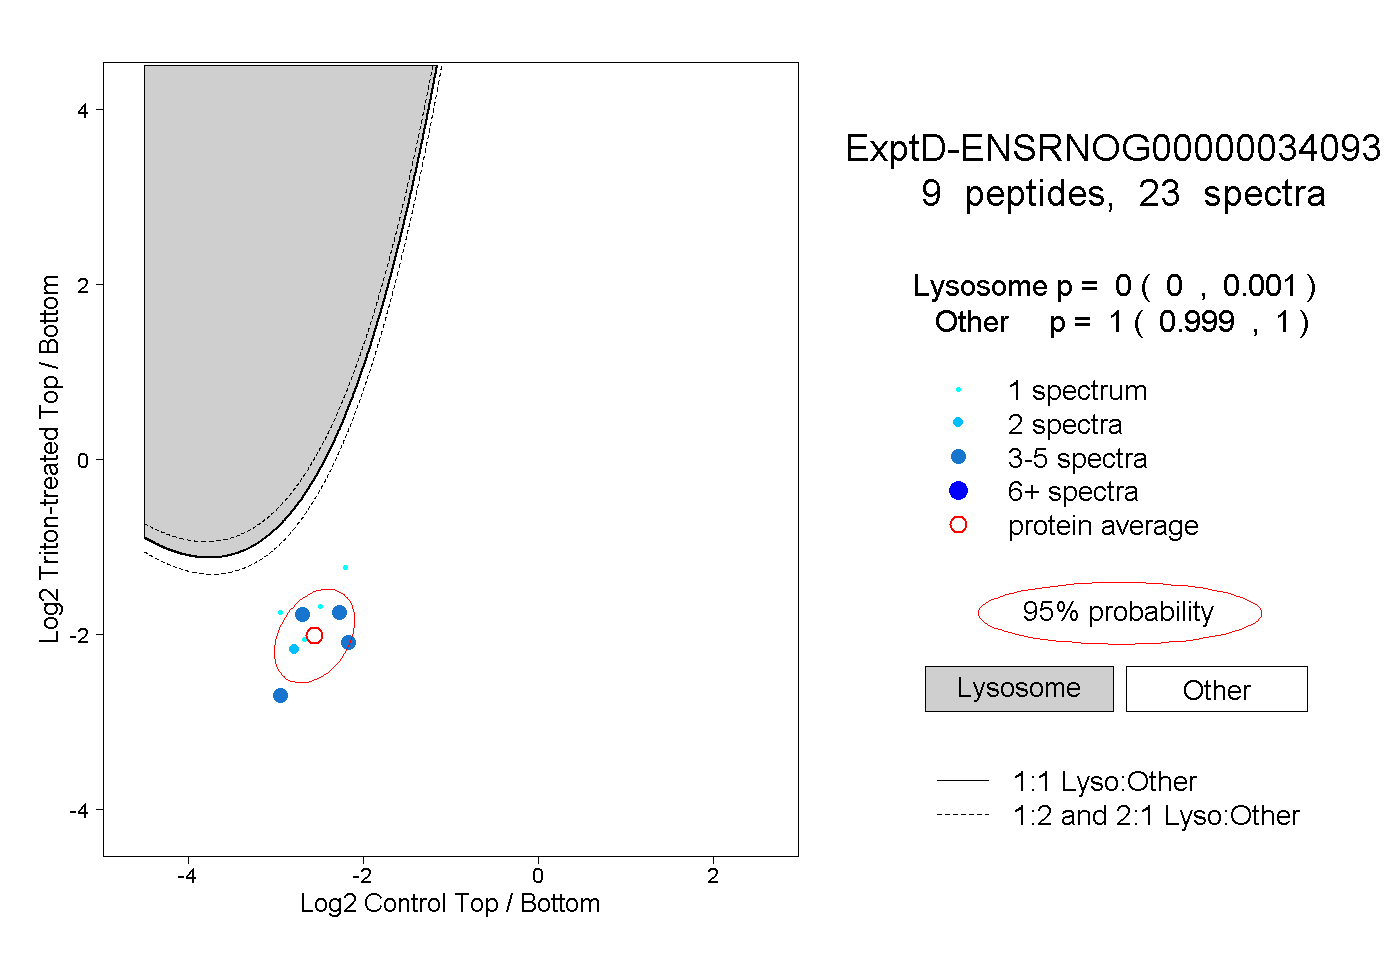 |
0.000 0.000 | 0.001 |
1.000 0.999 | 1.000 |