 3
3peptides
spectra
0.029 | 0.146
0.000 | 0.000
0.000 | 0.024
0.173 | 0.361
0.407 | 0.604
0.000 | 0.147
0.000 | 0.098
0.000 | 0.029
3peptides
spectra
0.000 | 0.000
1.000 | 1.000
| Plot | Mito | Lyso | Perox | ER | Golgi | PM | Cytosol | Nucleus | |||||
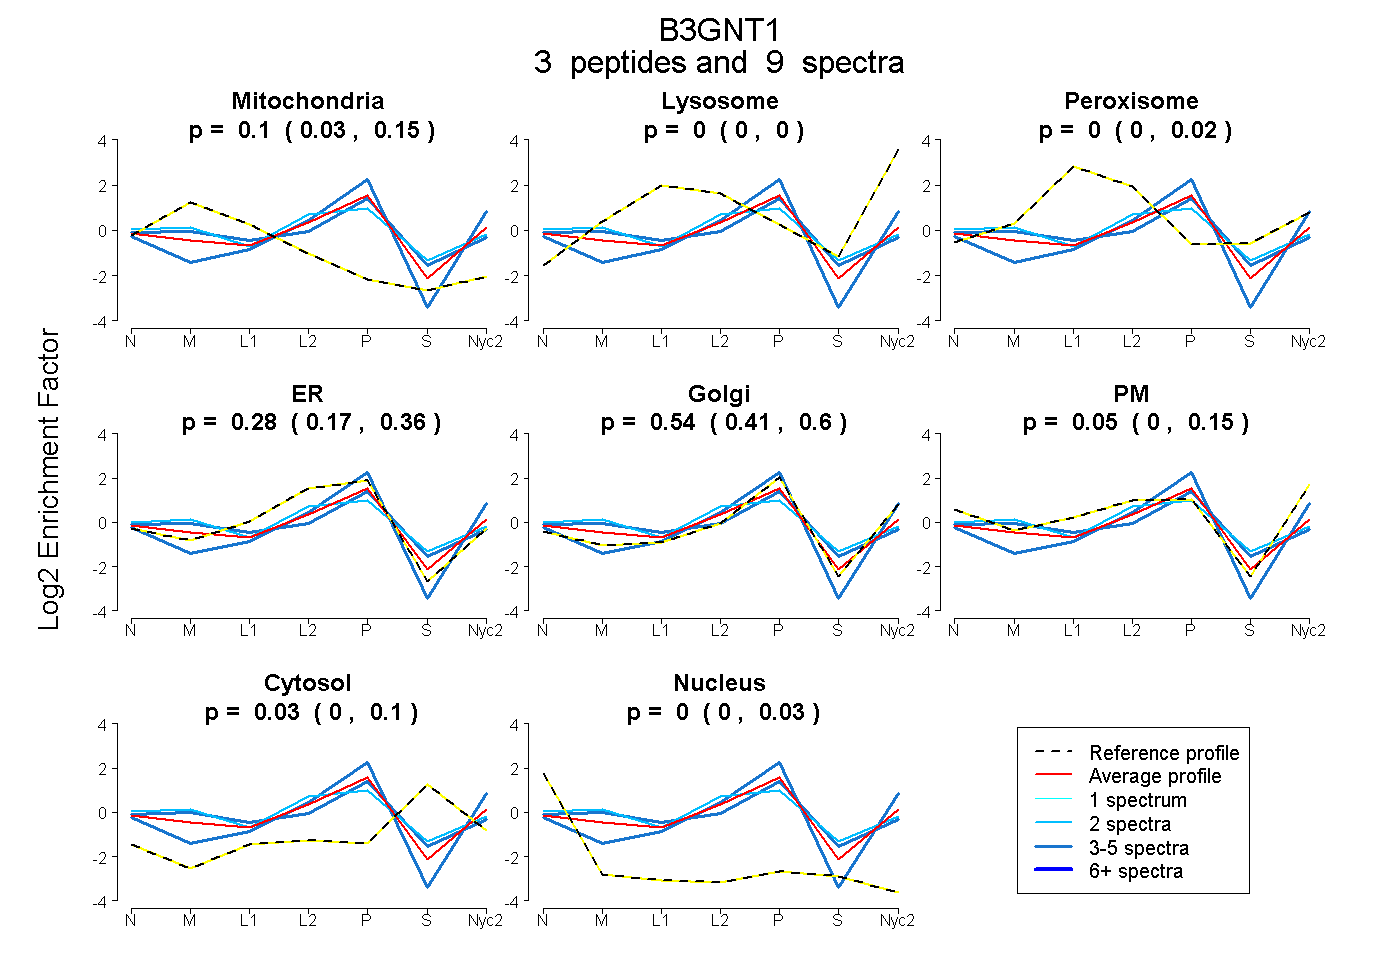
| Expt A |
3 peptides |
9 spectra |
|
0.104 0.029 | 0.146 |
0.000 0.000 | 0.000 |
0.000 0.000 | 0.024 |
0.276 0.173 | 0.361 |
0.535 0.407 | 0.604 |
0.053 0.000 | 0.147 |
0.031 0.000 | 0.098 |
0.000 0.000 | 0.029 |
||
| Plot | Lyso | Other | |||||||||||
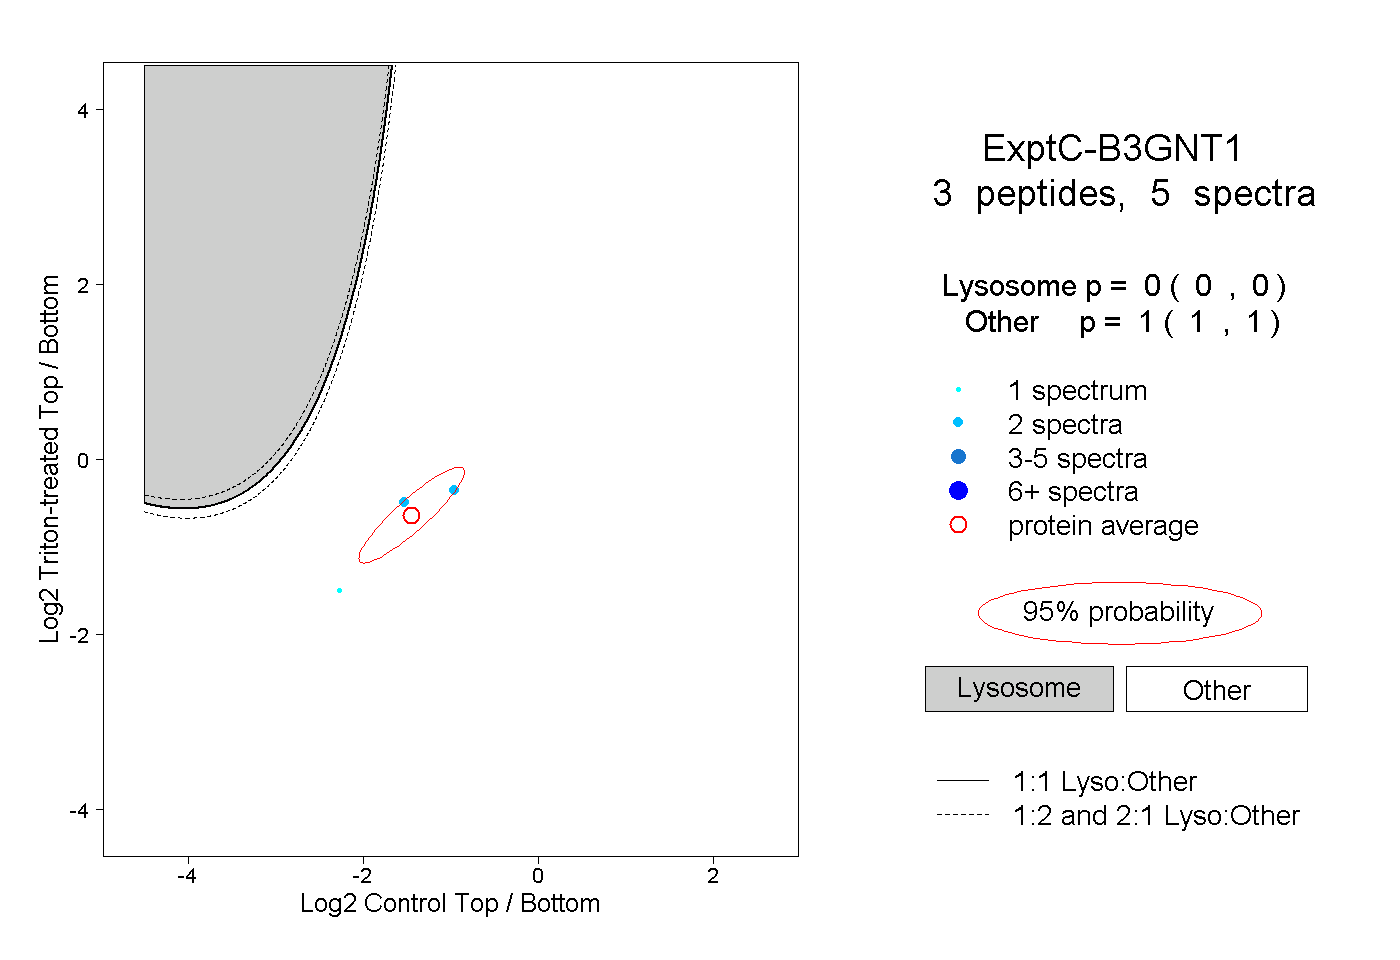
| Expt C |
3 peptides |
5 spectra |
|
0.000 0.000 | 0.000 |
1.000 1.000 | 1.000 |