 4
4peptides
spectra
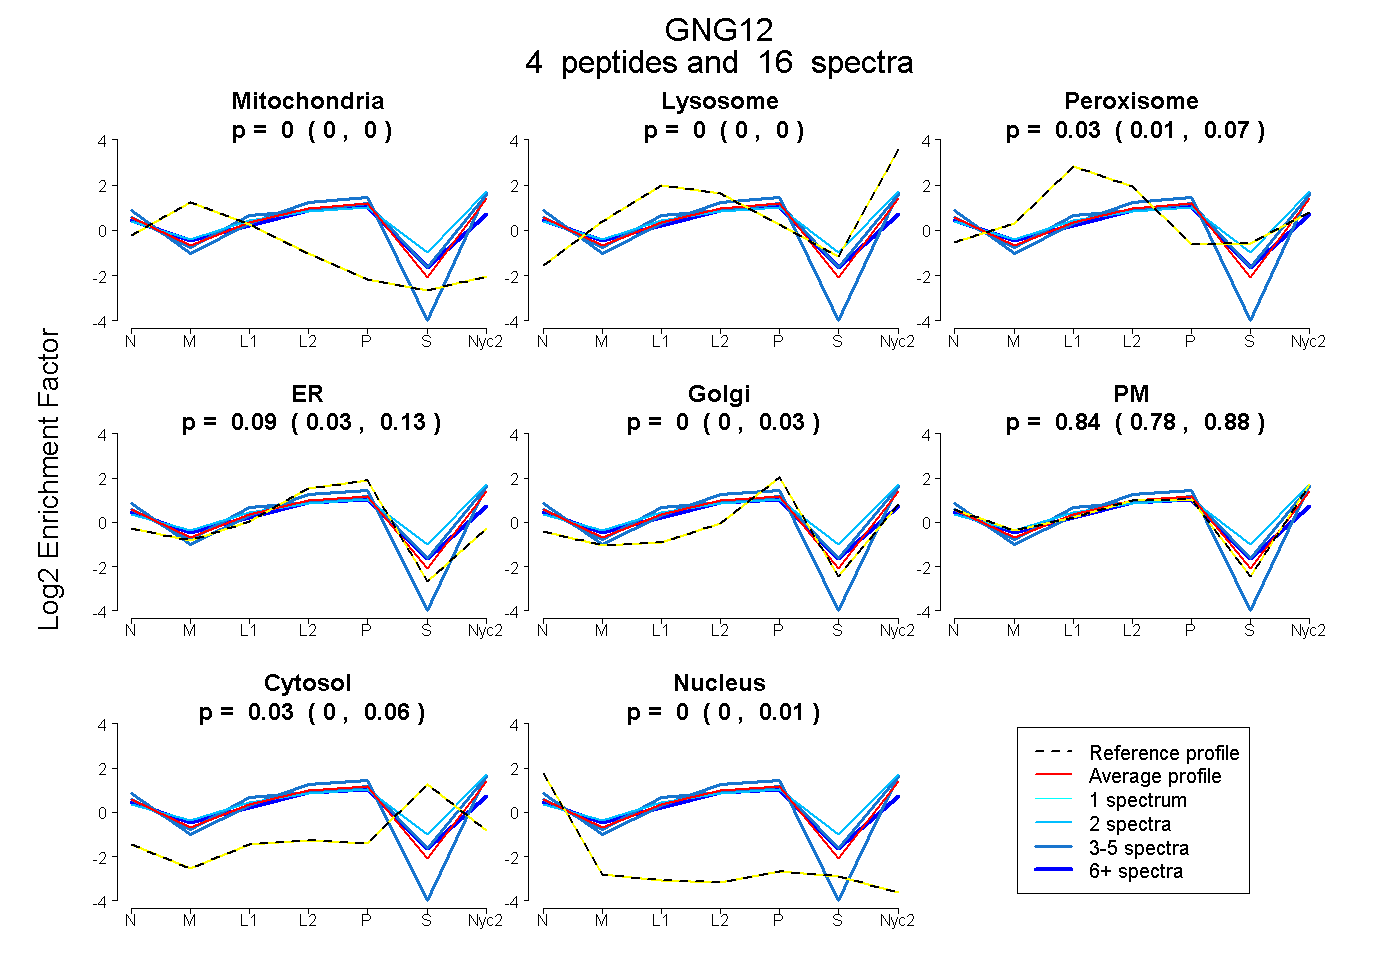
0.000 | 0.000
0.000 | 0.000
0.008 | 0.065
0.030 | 0.131
0.000 | 0.034
0.783 | 0.877
0.000 | 0.057
0.000 | 0.005
4peptides
spectra
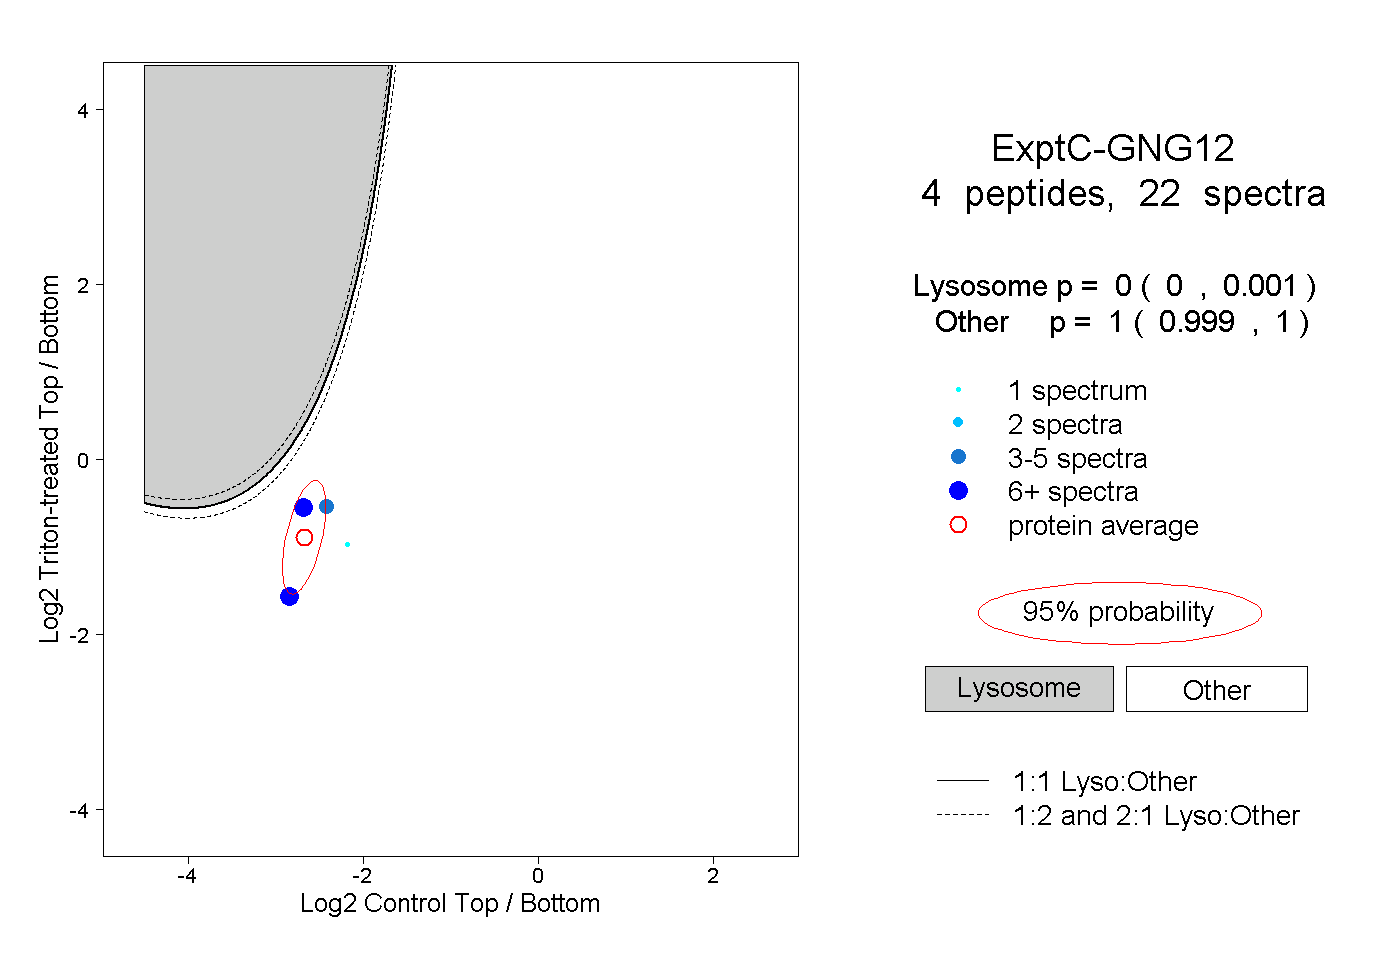
0.000 | 0.001
0.999 | 1.000
1peptide
spectrum
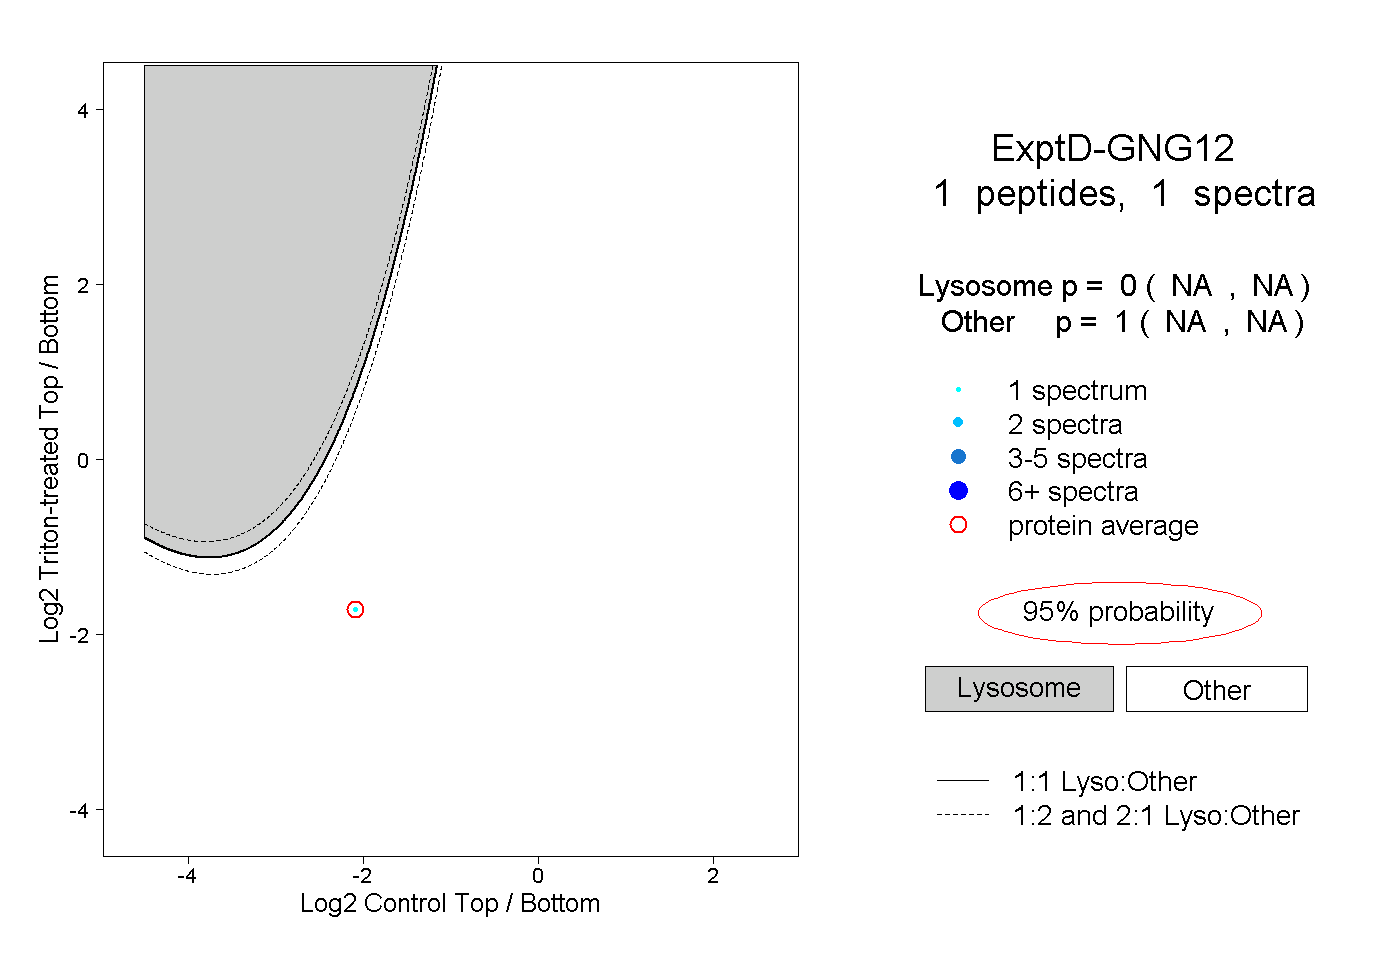
NA | NA
NA | NA