 3
3peptides
spectra
0.000 | 0.097
0.000 | 0.000
0.000 | 0.022
0.000 | 0.000
0.000 | 0.204
0.018 | 0.239
0.637 | 0.730
0.019 | 0.097
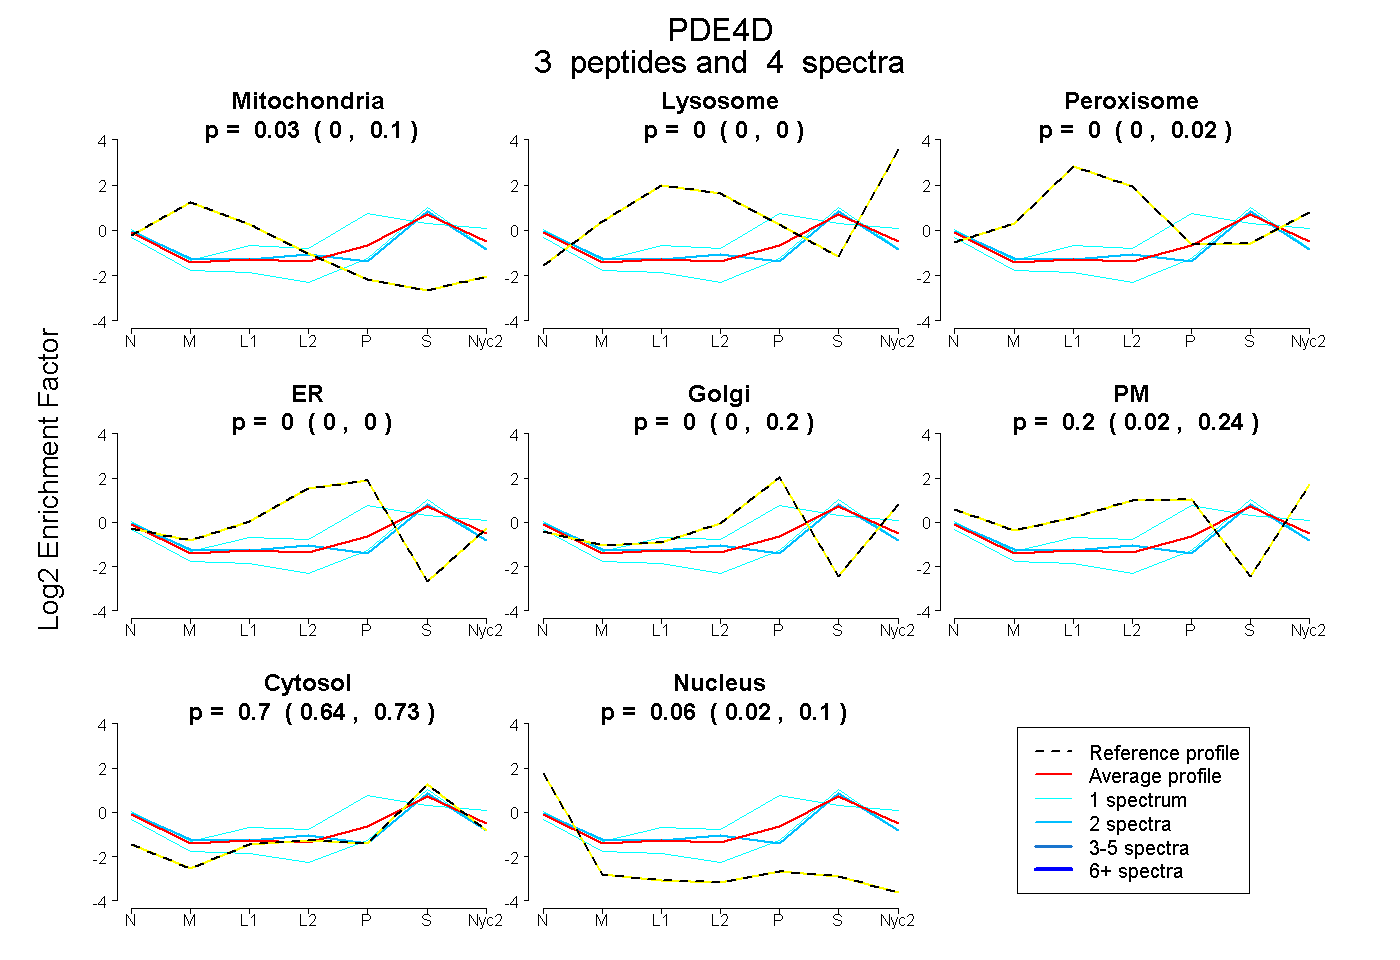
| Plot | Mito | Lyso | Perox | ER | Golgi | PM | Cytosol | Nucleus | |||||
| Expt A |
3 peptides |
4 spectra |
|
0.034 0.000 | 0.097 |
0.000 0.000 | 0.000 |
0.000 0.000 | 0.022 |
0.000 0.000 | 0.000 |
0.000 0.000 | 0.204 |
0.204 0.018 | 0.239 |
0.699 0.637 | 0.730 |
0.063 0.019 | 0.097 |
| 2 spectra, WGLHVFR | 0.118 | 0.000 | 0.056 | 0.000 | 0.000 | 0.068 | 0.688 | 0.070 | ||
| 1 spectrum, IMEEFFR | 0.011 | 0.000 | 0.000 | 0.000 | 0.001 | 0.031 | 0.809 | 0.148 | ||
| 1 spectrum, ATITEEAYQK | 0.000 | 0.000 | 0.021 | 0.000 | 0.273 | 0.204 | 0.502 | 0.000 |